This is a report on the performance of our share price model for Loews Corporation (NYSE: L). The model is based on the decomposition into a weighted sum of two consumer price indices (selected from a larger set of CPIs), linear trend and constant; all coefficients and time lags to be estimated by a LSQ procedure. A month ago we presented a quarterly report and confirmed the stability of the original model obtained in September 2009 for the period through October 2008. Here we test the previous model and make a regular update using new data through February 2012 (March 2012 for the share price). All in all, the original model is valid since October 2008 and does not show any clear sign of changes in the future. This is a reliable model valid during the past 52 months! A preliminary model for Loews Corp. was obtained in September 2009 and covered the period from October 2008. This old model included the index of food without beverages (FB) which led by 6 months and the index of transportation service (TS) with a 4 months lead:
L(t) = -2.52FB(t-6) – 1.38TS(t-4) +27.93(t-1990) + 377.24, stdev=$2.04, September 2009
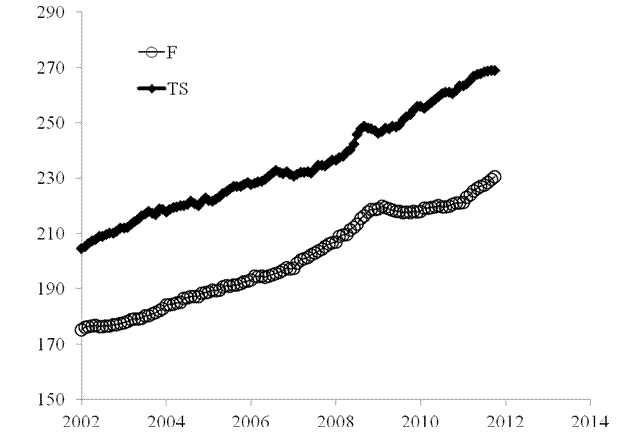
where L(t) is the share price in US dollars, t is calendar time. Since November 2010, the defining indices were the same: the index of food and beverages (F) and the TS index. Figure 1 depicts the evolution of the indices which provide the best fit model, i.e. the lowermost RMS residual error, between July 2003 and February 2011. The food and beverages index leads by 5 months and the TS index by 4 months. The model does not show any tangible change with time - only coefficients have been slightly fluctuating:
L(t) = -2.04F(t-5) – 2.08TS(t-4) +28.09(t-1990) + 441.81, November 2010L(t) = -2.03F(t-5) – 2.12TS(t-4) +28.23(t-1990) + 448.98, March 2011L(t) = -2.01F(t-5) – 2.09TS(t-4) +27.96(t-1990) +440.65, September 2011L(t) = -2.03F(t-5) – 2.02TS(t-4) +27.65(t-1990) +431.99, December 2011L(t) = -2.01F(t-5) – 2.01TS(t-4) +27.49(t-1990) +428.70, stdev=$2.41, February 2012
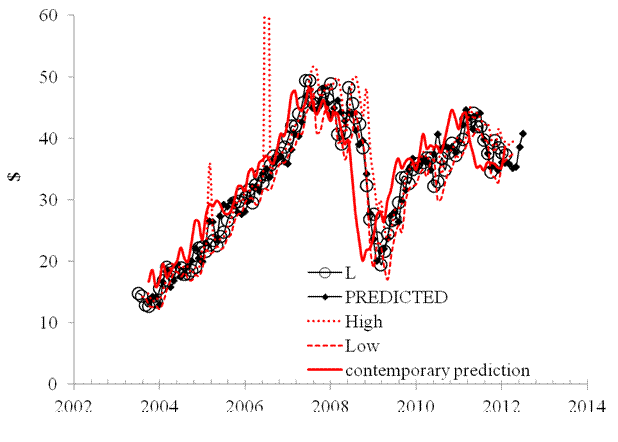
The current model is depicted in Figure 2 together with high and low monthly prices as a proxy to the uncertainty bound of the share price. The predicted curve leads the observed one by 4 months. The solid red line presents the contemporary prediction, i.e. one sees four months ahead. Major falls and rises are well forecasted four months in advance. It is worth noting that the model obtained in March 2011, accurately predicted the small fall observed in the second and third quarters of 2011.
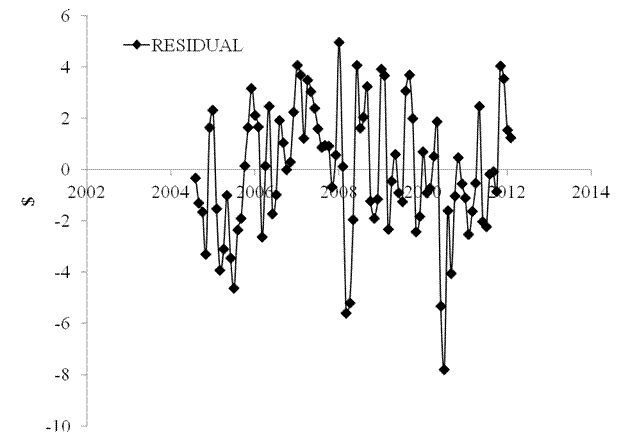
The model residual error is of $2.41 for the period between July 2003 and February 2011, as shown in Figure 3. In the first quarter of 2012, the model foresees essentially no change. In the second quarter, the price is expected to rise to $40 per share. 
Figure 1. Evolution of the price indices F and TS.
Figure 2. Observed and predicted share prices. 
Figure 3. The model residual error; stdev=$2.41.
- English (UK)
- English (India)
- English (Canada)
- English (Australia)
- English (South Africa)
- English (Philippines)
- English (Nigeria)
- Deutsch
- Español (España)
- Español (México)
- Français
- Italiano
- Nederlands
- Português (Portugal)
- Polski
- Português (Brasil)
- Русский
- Türkçe
- العربية
- Ελληνικά
- Svenska
- Suomi
- עברית
- 日本語
- 한국어
- 简体中文
- 繁體中文
- Bahasa Indonesia
- Bahasa Melayu
- ไทย
- Tiếng Việt
- हिंदी
Loews Corporation Share Price Q2 2012
Published 03/11/2012, 01:55 AM
Updated 07/09/2023, 06:31 AM
Loews Corporation Share Price Q2 2012
Latest comments
Loading next article…
Install Our App
Risk Disclosure: Trading in financial instruments and/or cryptocurrencies involves high risks including the risk of losing some, or all, of your investment amount, and may not be suitable for all investors. Prices of cryptocurrencies are extremely volatile and may be affected by external factors such as financial, regulatory or political events. Trading on margin increases the financial risks.
Before deciding to trade in financial instrument or cryptocurrencies you should be fully informed of the risks and costs associated with trading the financial markets, carefully consider your investment objectives, level of experience, and risk appetite, and seek professional advice where needed.
Fusion Media would like to remind you that the data contained in this website is not necessarily real-time nor accurate. The data and prices on the website are not necessarily provided by any market or exchange, but may be provided by market makers, and so prices may not be accurate and may differ from the actual price at any given market, meaning prices are indicative and not appropriate for trading purposes. Fusion Media and any provider of the data contained in this website will not accept liability for any loss or damage as a result of your trading, or your reliance on the information contained within this website.
It is prohibited to use, store, reproduce, display, modify, transmit or distribute the data contained in this website without the explicit prior written permission of Fusion Media and/or the data provider. All intellectual property rights are reserved by the providers and/or the exchange providing the data contained in this website.
Fusion Media may be compensated by the advertisers that appear on the website, based on your interaction with the advertisements or advertisers.
© 2007-2025 - Fusion Media Limited. All Rights Reserved.
