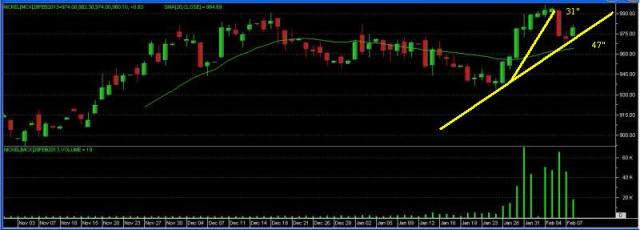
MCX Nickel February is witnessing a sideways trend. The indicators show a sideways phenomenon in all aspects as initial bullishness in overbought territory has moved sideways.
The reversal bump-and-run pattern formed when there was a sharp movement followed by the commodity in the upward direction and reversed its projection down, which implies a down trend.
On the charts, nickel tracks are showing a sideways phenomenon. The indicators were witnessing an overbought position for the contract in the beginning, but declined to a sideways trend. RSI at 56.50, slow stochastic level at 35.91 implies a bearish factor is to be expected. MACD stands positive and ROC dispersion above zero may turn into the lower levels.
If nickel trades below the 20-day SMA at 946.7, it may witness an all-time low in the past 52 weeks. The decline of LME Nickel to 18220 levels may reflect in MCX nickel soon.
- S1: 968.3 S2: 964.9
- R1: 981.7 R2:985.1

