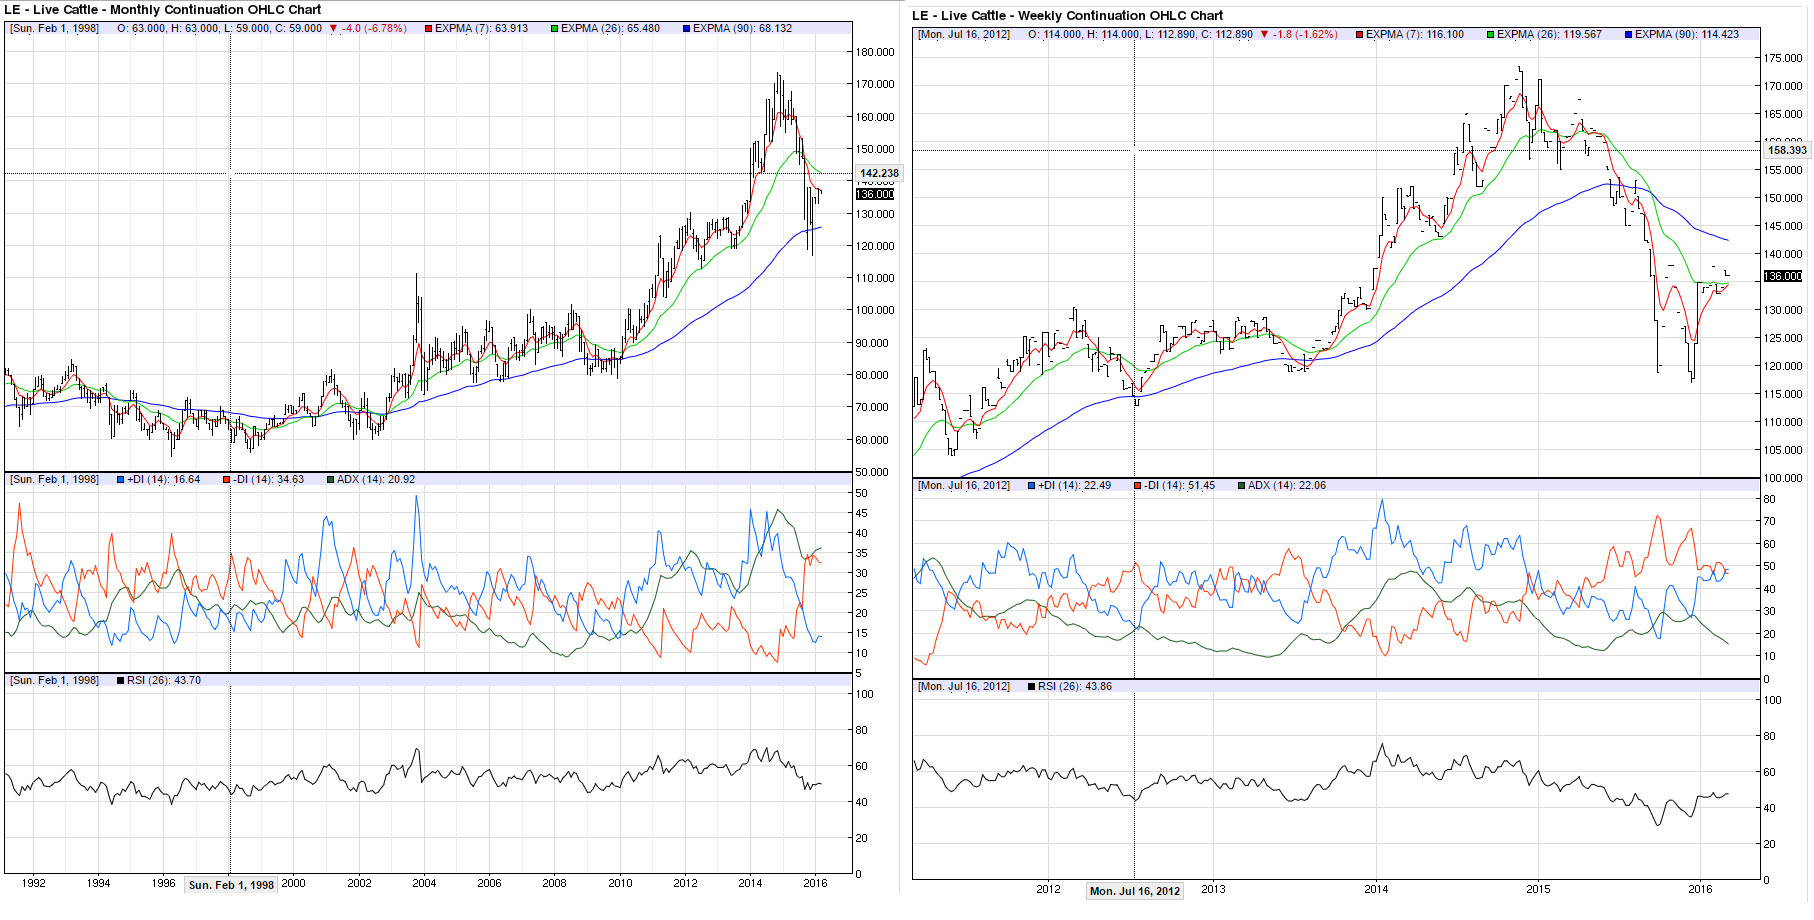
From a period of time beginning in 2003 through 2014, the cash price of live cattle went up by nearly 100 points/lb. In a period of roughly 14-15 months, the market has given back half of that. Even with 50% of the move returned, it’s hard to imagine that 12 years of price movement can be corrected in 14 to 15 months. Though, anything is possible.
The monthly and weekly cash charts for reference:
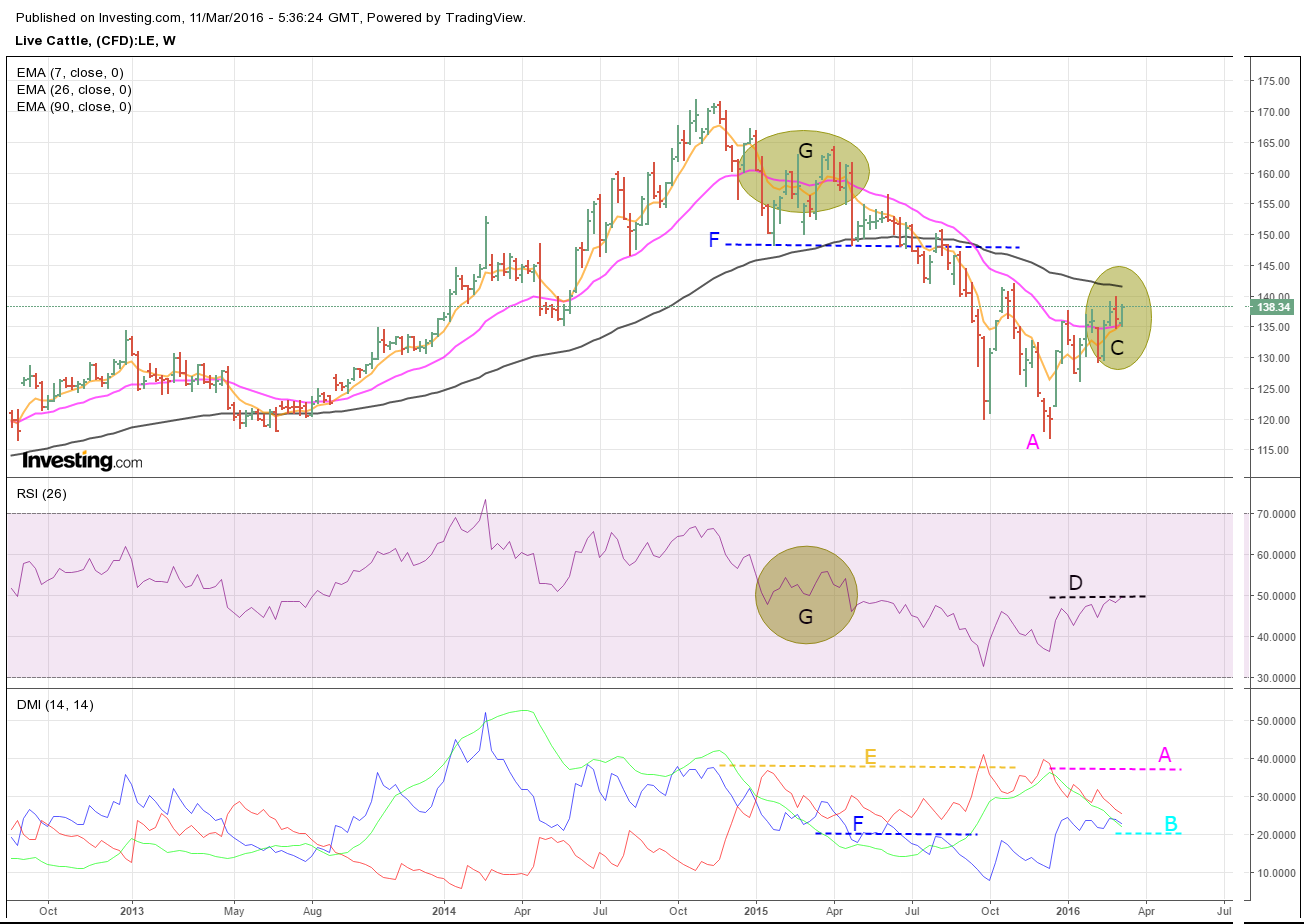
The Weekly Chart
There are several things going on in the weekly chart that I’d like to develop:
- The price movement from the 2014 high appears to be more of a correction than a bear market
- The initial phase of the correction is complete with a pullback looking to close soon
- There is more down side potential that is tradable, but not with same potential as initial down move
Price Movement is a Correction
- (E) The peak price achieved late 2014 produced a +DI level that has not legitimately been taken out by a -DI. There were a couple of brief periods where it touched or moved above, but it quickly retreated and couldn’t hold. This is the primary indicator, leading me to the conclusion that the price movement from the 2014 high is a correction
Initial Phase Complete
- Initial phase of the correction started with the 7-period EMA crossing down over the 26 period (G)
- The 26-period RSI moved down to 50 and eventually broke through (G)
- The ADX dropped below 20 and both the +/-DI (F). During this time, price found support but then dropped below. In close proximity, the 7-period EMA crossed down over the 90
- The low for the first phase was put in December 2015 (A). During this time, the 26-period RSI failed to make new lows with price, and the ADX began to decline
More Downside Potential
- The current price action from the low (A) is beginning to run into resistance. The length of time this pullback has been in play is open for interpretation, but understanding this may help in timing entry into a short position
- The 7-period EMA is beginning to test the 26 period (C)
- The price is beginning to test the 90-period EMA (C)
- The 26-period RSI is finding a ceiling at the 50 level
- The ADX is beginning to drop below both +/- DI with the – DI collapsing onto the +DI (B)
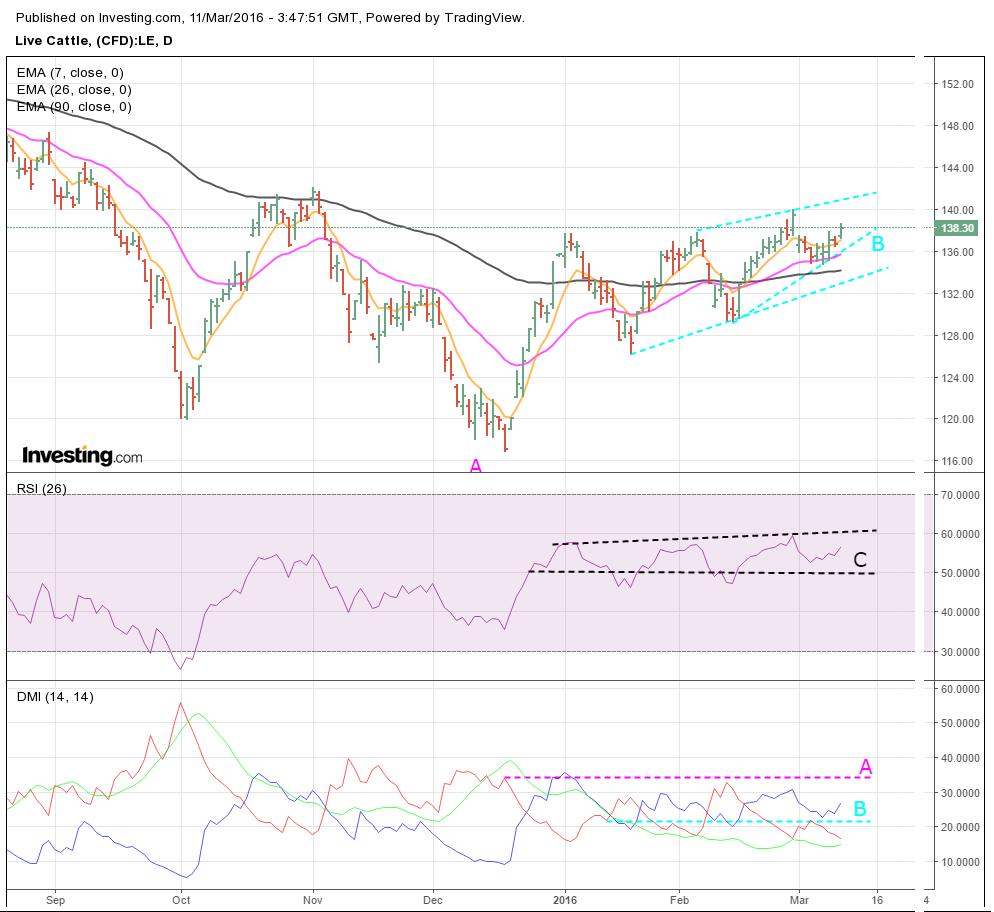
The Daily Chart
- The 26-period RSI has kept in a range between 50-60 (C)
- The ADX has been below 20 and the +/-DI for several weeks, with a couple of lines of support and resistance forming in price (B)
- The -DI that corresponds to the price low has held the +DI, which makes this price movement seem more like a pullback in the correction (A)
What to Watch
- On both daily and weekly charts, watch price as it nears either the lines of support or resistance
- Price may move higher, with the key support being the 90-period EMA on the weekly chart
- On the daily chart, the 7-period EMA and the 26-period have both crossed above the 90-period EMA, so pay close attention to see if they hold above. Or, if price drops off the resistance and brings them down
Time will evolve both charts to help clarify when a trade could be made to the short side.
