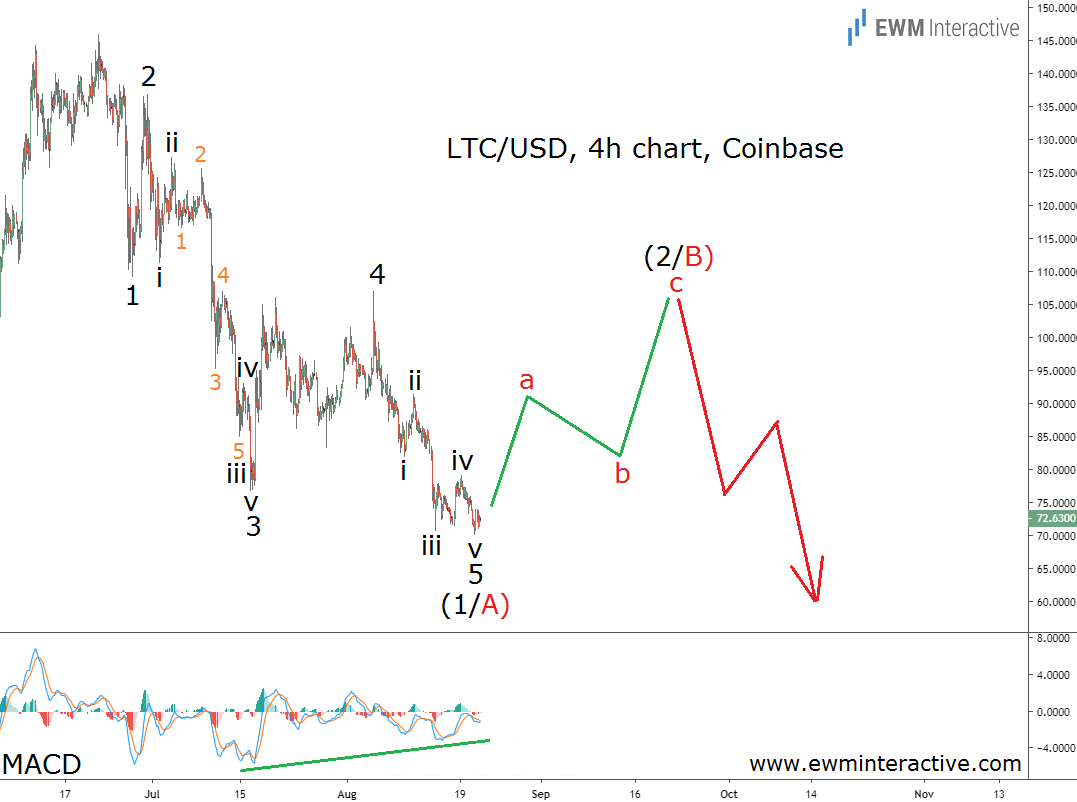
Litecoin, the fifth largest cryptocurrency, lost more than half of its market value in the past two months. Between June 22nd and August 21st, LTC/USD fell from $146 to $70.
Since crypto assets have no intrinsic value, investors often compare the current price to its higher level some time ago. This leads them to the faulty conclusion that the price is cheap and the cryptocurrency is a good investment. The truth is that in the absence of an intrinsic value estimate the distinction between cheap and expensive is extremely subjective.
Our way to deal with this problem is to look for price patterns instead of just price levels. In Litecoin’s case, the decline from $146 to $70 has formed an Elliott Wave pattern the bulls should be worried about. Take a look at it below.

The 4-hour chart of LTC/USD reveals that the recent weakness led to the formation of a textbook five-wave impulse pattern. Labaled 1-2-3-4-5, this structure indicates the direction of Litecoin’s larger trend. The sub-waves of wave 3 and 5 are also clearly visible.
On the other hand, a three-wave correction follows every impulse before the larger trend resumes. Here, we can expect a recovery to roughly $100. The resistance of wave 4 in that area should then discourage the bulls and give start to wave (3/C) down.
The MACD indicator supports the short-term positive outlook. It depicts a strong bullish divergence between waves 3 and 5, highlighting the bears’ exhaustion. If this count is correct, Litecoin may offer beaten-down investors some temporary relief. For long-term HODLers, however, the pain is by no means over. Wave (3/C) has the potential to drag LTC/USD much lower.
