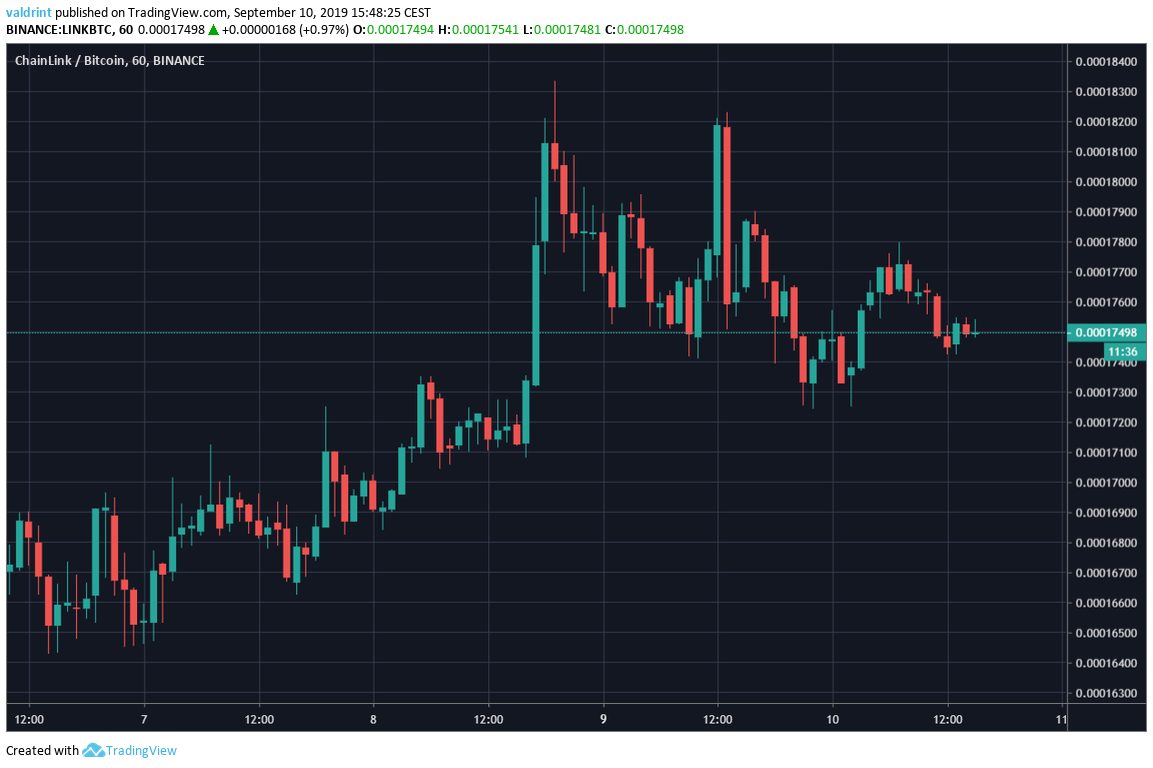
On September 7, 2019, the LINK price reached a low of 16,461 satoshis. An upward move ensued and the price reached a high of 18,332 satoshis on September 8. After a brief retracement, it reached similar levels the next day. It has been decreasing since.
Will LINK continue its upward movement or will it begin a downtrend? Continue reading below if you want to find out.
ChainLink Price: Trends and Highlights for September 10
Tracing Support
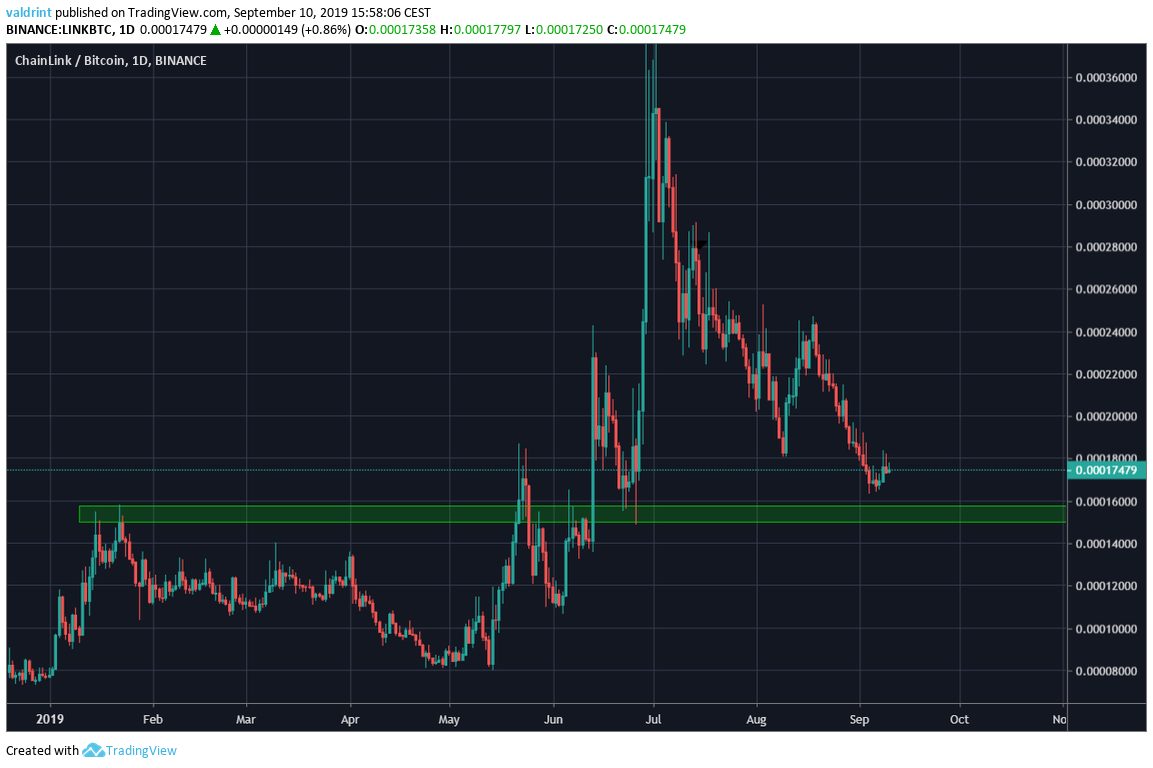
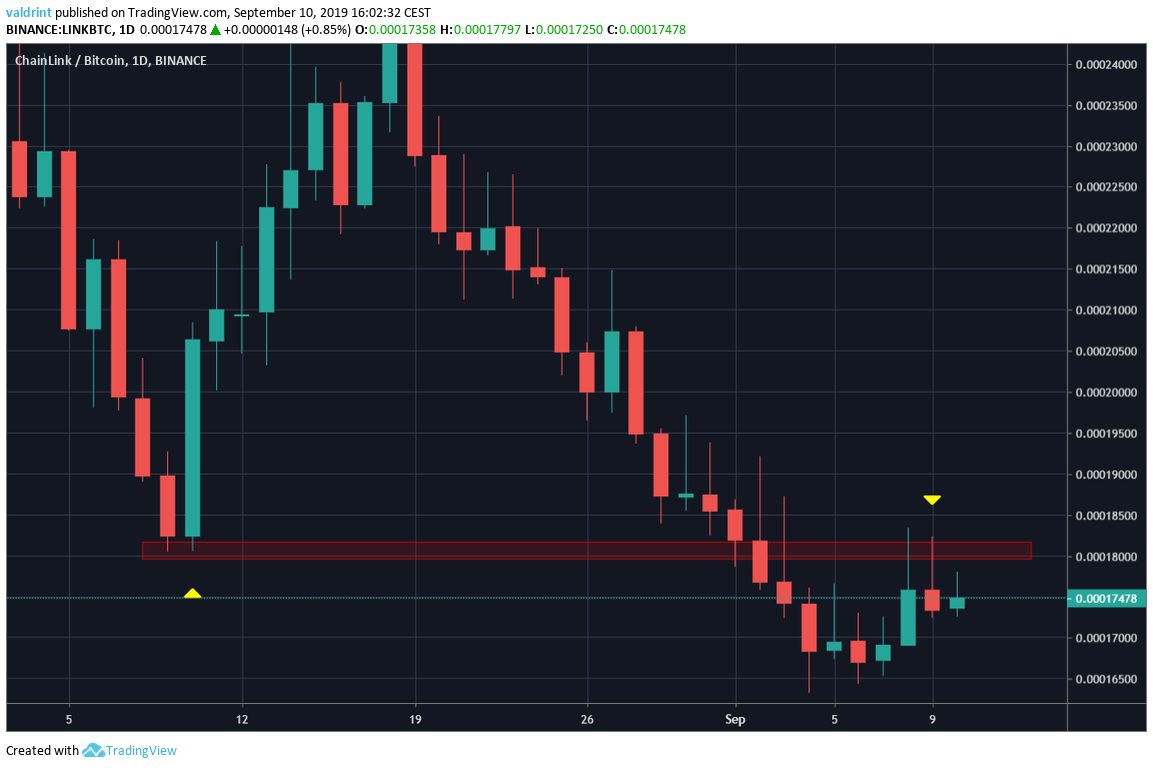
Looking at the daily time-frame we can see that LINK has been on an uptrend for the entirety of 2019.Additionally, we can see one support area, which is found at 15,500 satoshis.At the time of writing, the LINK price was trading slightly above it.However, looking closer, we can see that LINK recently broke down and validated the 18,000 satoshi level as resistance.On July 10, the LINK price began an upward move once it reached this level.However, it broke down from it on September 1 and validated it as resistance on September 8 and 9.It did so by creating long upper wicks.This is a sign of selling pressure and confirms the 18,000 level as future resistance.
Moving Averages
The bearish sentiment is further strengthened once we incorporate daily moving averages (MA) into the analysis:
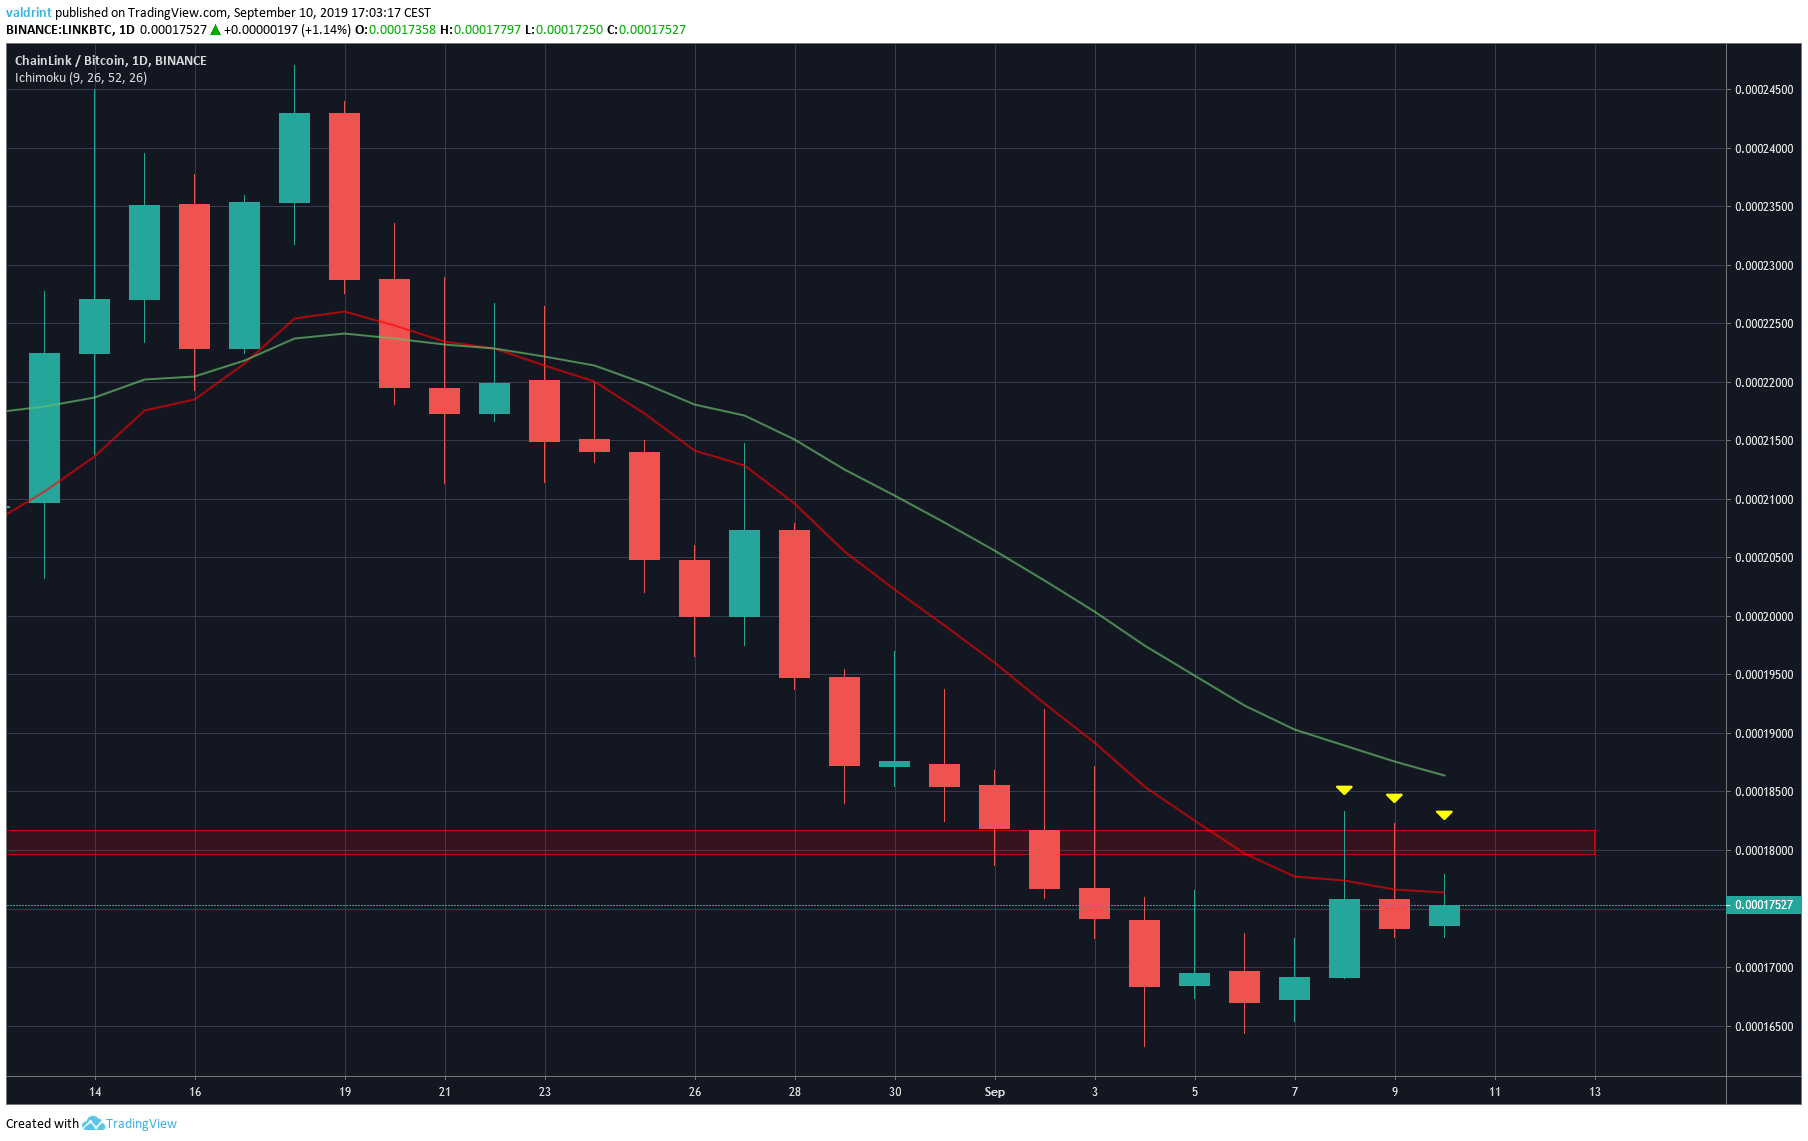
The Chainlink price is trading below both the 10- and 20-day MAs.
It if facing very close resistance from the former and has been unable to reach a price close above it.
To the contrary, it has not even reached the 20-day MA, creating long lower wicks once it got close to doing so.
This makes us believe that LINK is not yet done decreasing, and it is likely to reach the support area outlined in the first section.
Short-Term Movement
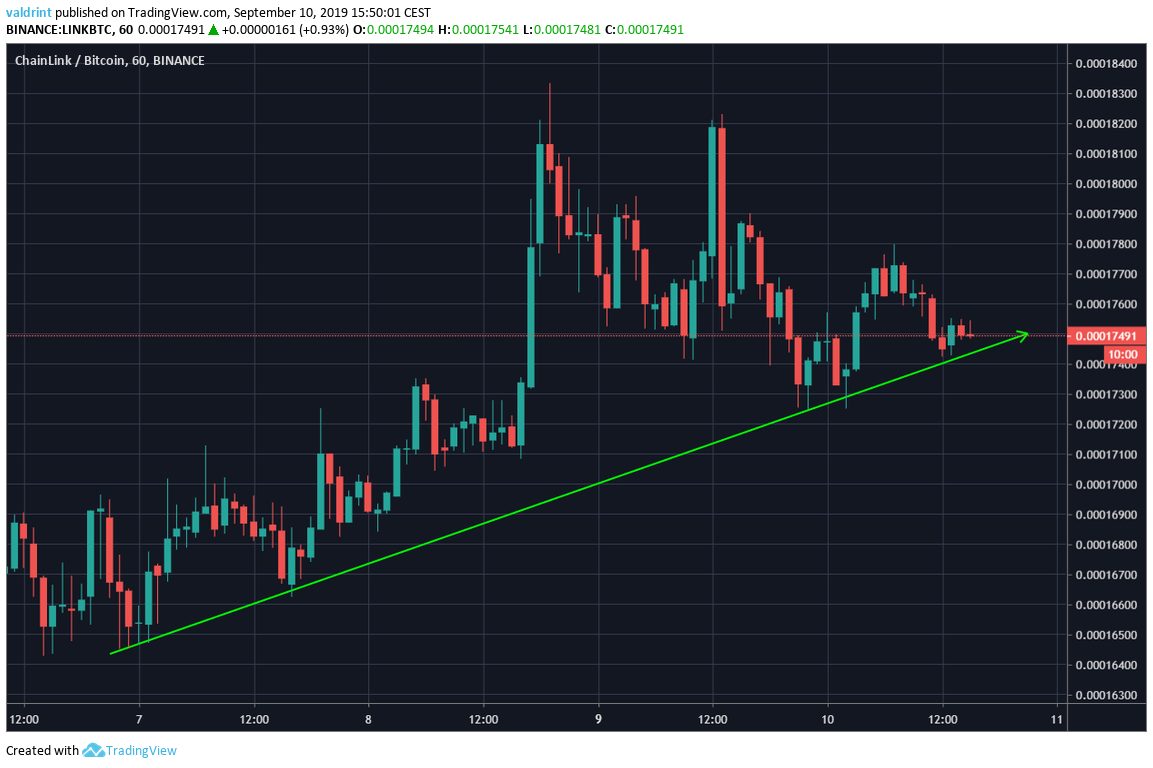
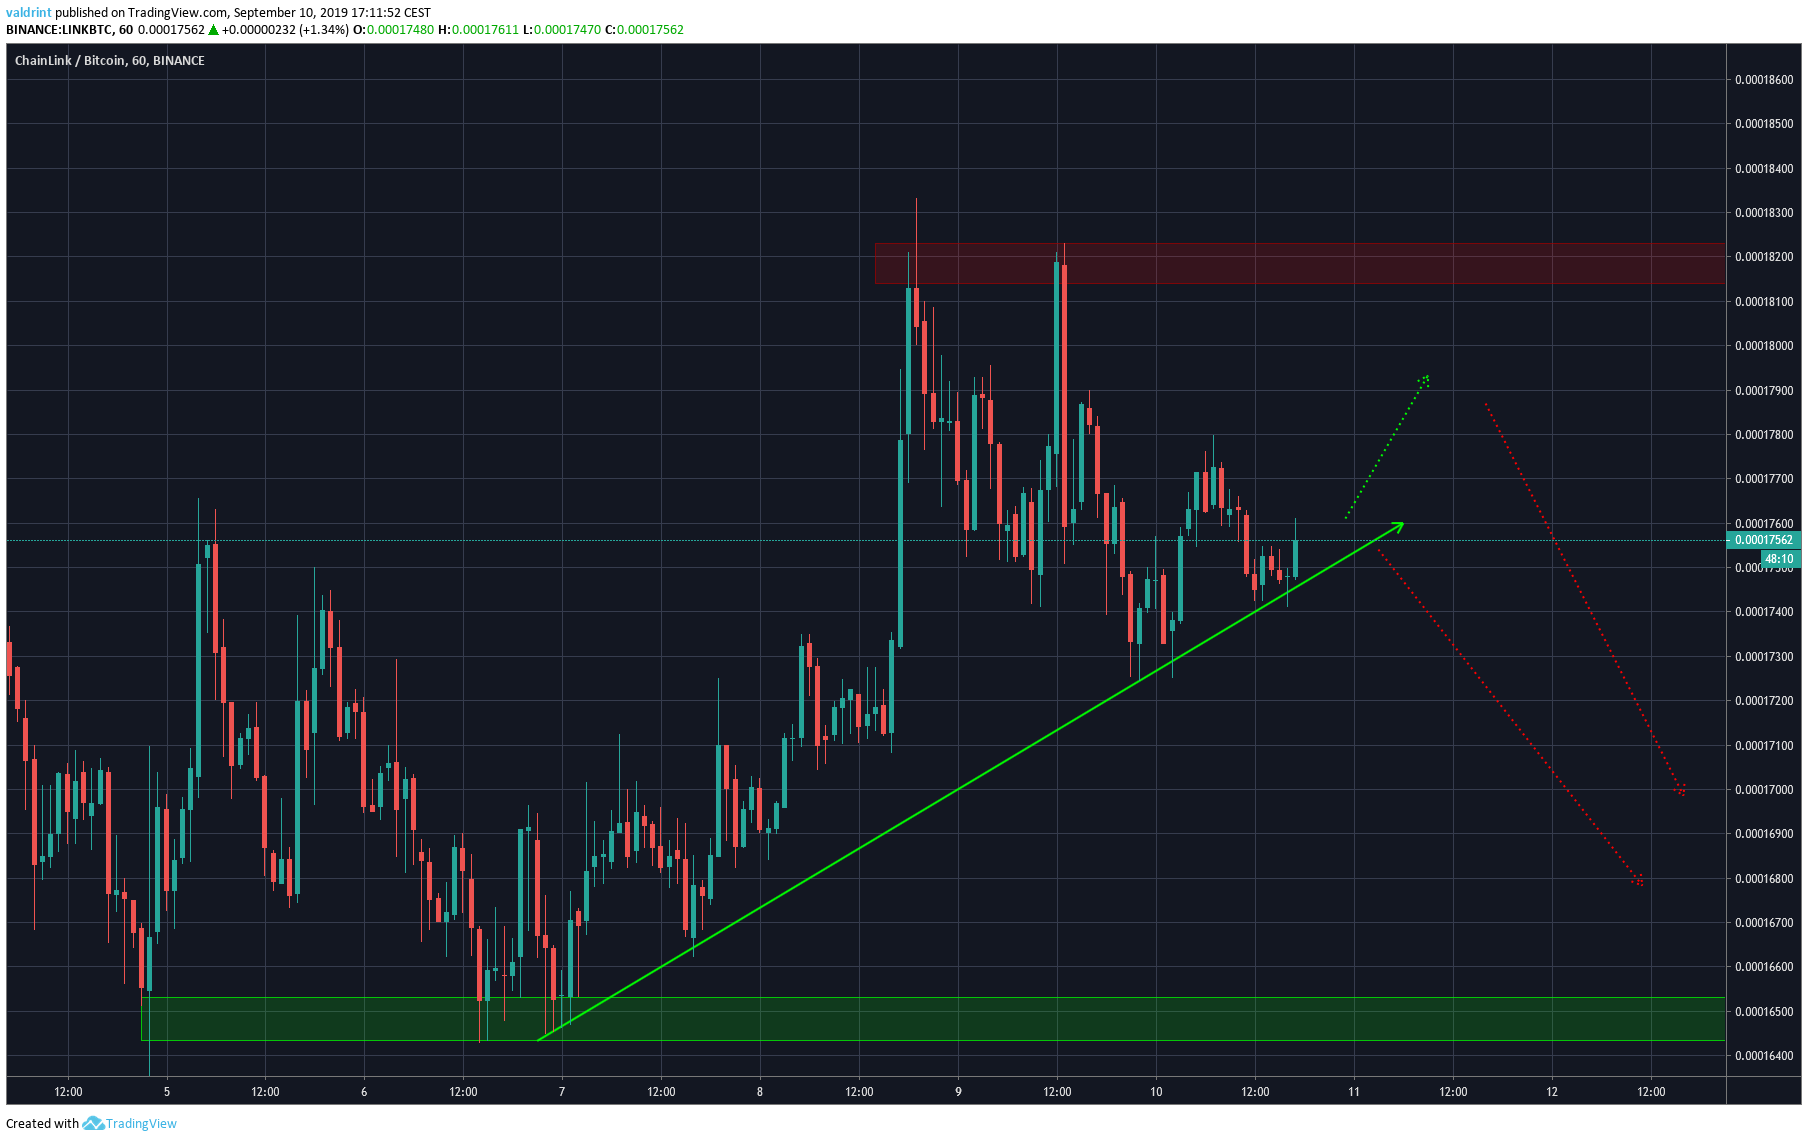
A look at the hourly time-frame shows that LINK has been following an ascending support line since September 7.At the time of writing, LINK was trading right on the support line.According to our analysis, it is likely to break down and reach the minor support area at 16,500 satoshis.However, it is possible that it first increases before breaking down.If it does, it is not likely to go above 18,000 satoshis.
Chainlink Price Summary
The LINK price has been following a short-term ascending support line.
According to our analysis, it is likely to break down and reach the support area at 15,550 satoshis.
For trading purposes, we have a neutral view for LINK, since at the current price level the potential for both losses and profits is similar.
Do you think LINK will break down from the support line? Let us know in the comments below.
Disclaimer: This article is not trading advice and should not be construed as such. Always consult a trained financial professional before investing in cryptocurrencies, as the market is particularly volatile.
