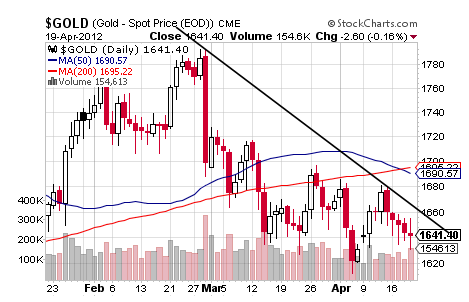
On first glance, gold’s not looking so good.
Not only is gold’s near-term trend down, but gold recently suffered a Death Cross with its 50 DMA dropping below its 200 DMA and something that suggests its intermediate-term trend may shift from sideways to down.
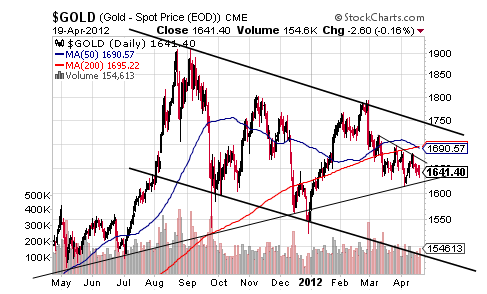
Such a possibility makes sense in the context of gold’s intermediate-term Descending Trend Channel that is likely to pull gold down toward its bottom trendline at about $1,475 per ounce and perhaps soon as in shortly after April 25 when the Fed fails to initiate QE3 or even intimate at its possibility. Supporting the failure to launch QE3 in Q2 is that Symmetrical Triangle that can result in a breakout to the upside or downside but with gold’s downside hover timed rather well to next week’s FOMC meeting for a little QE-On-Hold until at least the Twist is finished and the threat of deflation is on the rise as the spread between the nominal 5-year Treasury and 5-year TIPS drops below 1.5%.
In the case all of the above is not convincing enough for you, though, there’s even an additional Symmetrical Triangle at hand that presents bearishly with a Bear Flag Pole-type aspect to precede it. Let’s look at both sides, though, with the upside confirming at $1,693 per ounce for a target of $1,774 per ounce while it confirms to the downside at $1,612 per ounce for a target of $1,531 per ounce and closing confirmation is required in this case.
Before turning to the bearish Halloween death wish Death Cross called silver, let me share once again my opinion on the “Inverse Head and Shoulders” pattern that is being touted by many as a reason to be bullish on gold and put simply, it just is a bad pattern based on its proportions and now the fact that it will be fighting that 50 DMA drop through its 200 DMA and something that last led to a 20%+ decline in 2008 not to mention the fact that gold has been unable to reclaim its all-important 150 DMA.
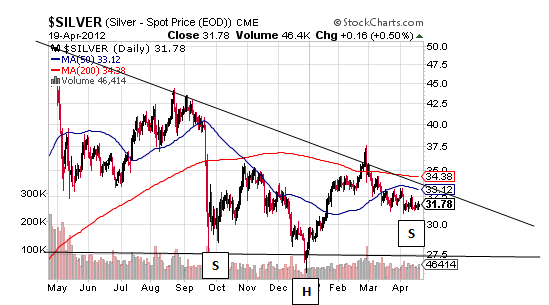
And now moving on to silver with the key levels to watch in gold showing at the aforementioned $1,612 and $1,693 per ounce with a close above the latter perhaps changing the status of that IHS mutation, silver made the death cross last fall and as a result, its intermediate-term trend is just down as opposed to the seemingly ubiquitous sideways. 
Interestingly, though, this means its IHS pattern is an okay pattern considering there is an actual downtrend to reverse, but its rounding down 50 DMA does not speak so well to confirmation at about $37.50 per ounce for a target of about $46.50 per ounce.
Rather there is a large Descending Triangle that can be made of that pattern that shows only partially above and one that confirms around $26 per ounce for a single digit target.
Even the silver bear in me doesn’t take that target too seriously, but silver’s potential Descending Triangle suggests to me that silver’s long-term uptrend may soon reverse to sideways as silver drops toward its QE2 Launch Pad of about $18 per ounce if not lower.
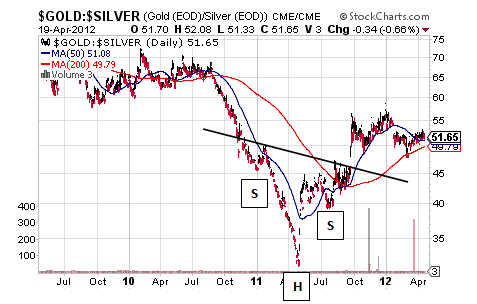
This claim is probably disconcerting to many so let’s take a look at one last chart – and the arbiter in this case – and that is the always-handy chart of the gold/silver ratio as shown on the following page.
Not surprisingly, it made a true Golden Cross last fall and now appears to be trading in a confirmed and respectable Inverse Head and Shoulders pattern that actually has a real downtrend to reverse.
This Inverse Head and Shoulders pattern in the chart of the gold/silver ratio remains confirmed above about 46 for a reasonable-in-relation-to-the-sideways-trend target of 60. 
Interestingly, though, if this pattern is successful, it will put the gold/silver ratio at the bottom of a sideways trend that suggests it could climb to the top of that range and above 70 so long as that 46 level holds.
Overall, then, taking a look at gold and silver offers a possibly bearish peak into the future.
- English (UK)
- English (India)
- English (Canada)
- English (Australia)
- English (South Africa)
- English (Philippines)
- English (Nigeria)
- Deutsch
- Español (España)
- Español (México)
- Français
- Italiano
- Nederlands
- Português (Portugal)
- Polski
- Português (Brasil)
- Русский
- Türkçe
- العربية
- Ελληνικά
- Svenska
- Suomi
- עברית
- 日本語
- 한국어
- 简体中文
- 繁體中文
- Bahasa Indonesia
- Bahasa Melayu
- ไทย
- Tiếng Việt
- हिंदी
Let’s Look At Gold And Silver
Published 04/20/2012, 12:48 AM
Updated 07/09/2023, 06:31 AM
Let’s Look At Gold And Silver
Latest comments
Loading next article…
Install Our App
Risk Disclosure: Trading in financial instruments and/or cryptocurrencies involves high risks including the risk of losing some, or all, of your investment amount, and may not be suitable for all investors. Prices of cryptocurrencies are extremely volatile and may be affected by external factors such as financial, regulatory or political events. Trading on margin increases the financial risks.
Before deciding to trade in financial instrument or cryptocurrencies you should be fully informed of the risks and costs associated with trading the financial markets, carefully consider your investment objectives, level of experience, and risk appetite, and seek professional advice where needed.
Fusion Media would like to remind you that the data contained in this website is not necessarily real-time nor accurate. The data and prices on the website are not necessarily provided by any market or exchange, but may be provided by market makers, and so prices may not be accurate and may differ from the actual price at any given market, meaning prices are indicative and not appropriate for trading purposes. Fusion Media and any provider of the data contained in this website will not accept liability for any loss or damage as a result of your trading, or your reliance on the information contained within this website.
It is prohibited to use, store, reproduce, display, modify, transmit or distribute the data contained in this website without the explicit prior written permission of Fusion Media and/or the data provider. All intellectual property rights are reserved by the providers and/or the exchange providing the data contained in this website.
Fusion Media may be compensated by the advertisers that appear on the website, based on your interaction with the advertisements or advertisers.
© 2007-2024 - Fusion Media Limited. All Rights Reserved.
