The movie 'Thank You for Smoking' is about a spin-doctor who works for big tobacco. His job is to discredit the evidence presented by anti-smoking groups like medical associations and health-advocate groups through obfuscation, and by quoting research findings from the tobacco industry's own research organization. The tobacco industry funded research organization intentionally hires misguided researchers who publish spurious studies with bold headings but insignificant findings.
The investment industry smacks of a similar plot. Investment firms hire research analysts to make forecasts about the economy and future market prices, but there's a catch. Banks and investment firms make substantial income by helping public companies raise cash in markets by selling stock to the public. But companies may delay expansion plans, which requires new capital from markets, if they perceive that the economy or markets may weaken. And investors won't buy new stock or bonds from these companies if they feel they may be able to get the same stock or bonds at lower prices in the future.
So what are these strategists to do? In our experience, strategists say what they need to say to keep their jobs. That is, they do what they can to find data to support optimistic forecasts, to keep the deals flowing. Incidentally, optimistic forecasts are much more palatable to TV stations and newspapers, so optimistic analysts appear on TV more often, which is a self-reinforcing problem.
This phenomenon reared its ugly head recently during a presentation from a large Canadian pension consulting firm. The firm cited spurious sources to assert that stock returns over the next 10 years were likely to be higher than average. We stayed behind afterward to discuss their analysis, and presented them with a more comprehensive version of the analysis we are about to present to you below. They were persuaded by our analysis, but the presenter then inquired:
But what do you tell clients?
If you're a chicken, would you trust Colonel Sanders to give you an honest forecast about your future?
Don't Be a Chicken
If you listen to most investment professionals quoted in the newspaper or on TV, then you're effectively making the same mistake. That's because most investment professionals quote 'rule of thumb' ratios related to economic activity, market valuation, etc. in order to make optimistic forecasts about the future without any evidence that these ratios are meaningful.
In most cases, the statistical significance of widely cited economic and market valuation ratios is effectively zero. The most common ratio cited by strategists is related to the market's Price to Earnings ratio, which is the ratio between the current value of an index (for example, as I write the S&P 500 index is trading at 1365) divided by the aggregate earnings generated by all of the companies in the index (trailing earnings for companies in the S&P 500 over the past 12 months are about $91.50). If we use earnings over the last 12 months to generate our PE ratio, it is called the Trailing Twelve Month, or TTM PE; it is currently 14.92 (1365 / 91.50).
Analysts sometimes also cite the Forward PE, which is based on analysts' own estimates for company earnings over the next 12 months. This is doubly suspect, because they are basing a forecast on another forecast. Yikes!
Using data from Robert Shiller's database, which has market data back to 1870, as well as information from the Federal Reserve, and Standards and Poors, we studied the efficacy of various market valuation techniques to forecast future market returns over meaningful time periods of 5 to 30 years. We used statistical regression techniques to discover the statistical significance of each valuation metric in order to separate meaningful metrics from spurious ones.
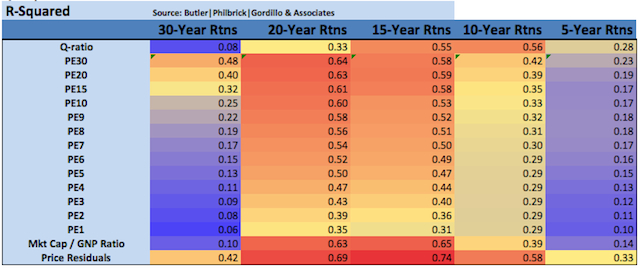
Matrix 1. below quantifies the ability of each of the valuation metrics we studied to forecast future returns over each horizon.
Matrix 1. Explanatory power of valuation metrics over various horizons (R-Squared value).
The third row from the bottom of Matrix 1. illustrates the explanatory power of the TTM PE ratio to forecast future returns at each horizon (1 is good, 0 is bad). Despite being the most commonly cited valuation metric, you can see that this ratio exhibits the lowest explanatory power of any ratio over all forecast horizons.
In contrast, the ratio with the greatest explanatory impact is the price residual data at the 15-year horizon, with a factor of 0.74 (bottom row). For more on this metric, please see this post from Doug Short.
Just the Facts
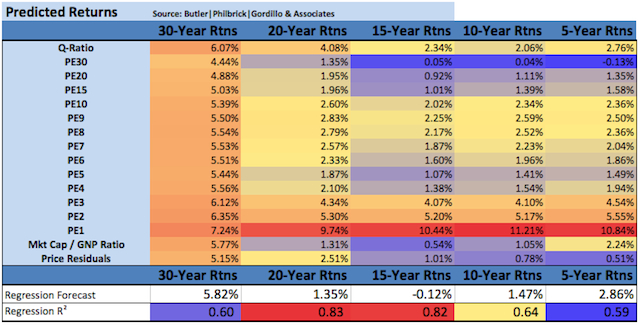
Matrix 2. provides the current forecasts for market returns over the same horizons using the same market valuation metrics.
Matrix 2. Forecasts for metrics over various horizons (annualized total return after inflation).
Focusing on the PE1 or TTM ratio again, you can see that this ratio provides for the highest forecast rate of return of all the ratios in the matrix. For example, this ratio forecasts returns of 11.21% over the next 10 years, and almost 11% over the next 5 years. Pretty exciting!
Unfortunately, the most optimistic forecasts in the matrix have the lowest forecasting accuracy. Which begs the question:
Do strategists start with the answer they want, and then torture the data until they get it?
Obviously, we subscribe to the opposite approach:
Start with an open mind and let the data tell the story.
To achieve the best accuracy we integrated several of the most powerful explanatory ratios using multiple regression. The second row from the bottom provides the results from this analysis, and the bottom row shows the explanatory power. You can see that our model has the most explanatory power at the 15-year and 20-year horizons (R-squared ratios of 0.82 and 0.83), and the model forecasts returns of -0.12% and 1.35% over these horizons, respectively.
What do we tell clients?
How about the truth?! If history is any guide (and what else do we have to go on, really?), then stocks are unlikely to deliver meaningful returns over the next 20 years after inflation. Of course that doesn't mean that stocks won't offer any opportunities over that period, only that stocks are likely to offer much better value at least once over the next two decades.
In the meantime, stocks and other asset classes will go through long periods of bull and bear markets, which means lots of opportunities for gains over coming years for those with the tools to harvest fleeting opportunities. The Global Dynamic Asset Allocation approach that we employ is a good option for any market, but especially useful during periods where stocks on their own are likely to experience headwinds.
- English (UK)
- English (India)
- English (Canada)
- English (Australia)
- English (South Africa)
- English (Philippines)
- English (Nigeria)
- Deutsch
- Español (España)
- Español (México)
- Français
- Italiano
- Nederlands
- Português (Portugal)
- Polski
- Português (Brasil)
- Русский
- Türkçe
- العربية
- Ελληνικά
- Svenska
- Suomi
- עברית
- 日本語
- 한국어
- 简体中文
- 繁體中文
- Bahasa Indonesia
- Bahasa Melayu
- ไทย
- Tiếng Việt
- हिंदी
Let the Data Tell the Story
Published 03/11/2012, 12:52 AM
Updated 07/09/2023, 06:31 AM
Let the Data Tell the Story
Latest comments
Loading next article…
Install Our App
Risk Disclosure: Trading in financial instruments and/or cryptocurrencies involves high risks including the risk of losing some, or all, of your investment amount, and may not be suitable for all investors. Prices of cryptocurrencies are extremely volatile and may be affected by external factors such as financial, regulatory or political events. Trading on margin increases the financial risks.
Before deciding to trade in financial instrument or cryptocurrencies you should be fully informed of the risks and costs associated with trading the financial markets, carefully consider your investment objectives, level of experience, and risk appetite, and seek professional advice where needed.
Fusion Media would like to remind you that the data contained in this website is not necessarily real-time nor accurate. The data and prices on the website are not necessarily provided by any market or exchange, but may be provided by market makers, and so prices may not be accurate and may differ from the actual price at any given market, meaning prices are indicative and not appropriate for trading purposes. Fusion Media and any provider of the data contained in this website will not accept liability for any loss or damage as a result of your trading, or your reliance on the information contained within this website.
It is prohibited to use, store, reproduce, display, modify, transmit or distribute the data contained in this website without the explicit prior written permission of Fusion Media and/or the data provider. All intellectual property rights are reserved by the providers and/or the exchange providing the data contained in this website.
Fusion Media may be compensated by the advertisers that appear on the website, based on your interaction with the advertisements or advertisers.
© 2007-2025 - Fusion Media Limited. All Rights Reserved.
