
Legg Mason Inc. (NYSE:LM) reported positive earnings surprise of 5.8% in third-quarter fiscal 2019 (ended Dec 31). The company reported adjusted net income of 73 cents per share, outpacing the Zacks Consensus Estimate of 69 cents. However, the reported figure declined 27.7% year over year.
Fall in revenues, resulting from lower investment advisory fees and higher expenses were reflected in the quarter. Moreover, lower assets under management (AUM) were recorded.
Including certain one-time items, Legg Mason reported net loss of $216.9 million or $2.55 per share compared with net income of $149.2 million or $1.58 recorded in the year-ago quarter.
Revenues Decline, Expenses Escalate
Legg Mason’s total operating revenues in the reported quarter came in at $704.3 million, down 11.2% year over year. The fall mainly resulted from lower non-pass performance fees and reduced average long-term AUM. Further, the revenue figure lagged the Zacks Consensus Estimate of $717.5 million.
Investment advisory fees slipped 11.2% year over year to $630.5 million in the quarter. Distribution and service fees were down 11.4% year over year to $72.2 million. Nonetheless, other revenues climbed 6.3% year over year to $1.7 million.
Operating expenses rose 15% to $940.7 million on a year-over-year basis. This upsurge can chiefly be attributed to higher impairment of intangible assets expenses and other costs.
Non-operating expense was $30.3 million, significantly rising year over year.
Adjusted operating margin of Legg Mason was 21.1% in the Dec-end quarter, down from 27.2% recorded in the prior-year quarter.
Assets Position
As of Dec 31, 2018, Legg Mason’s AUM was $727.2 billion, down 5.2% year over year from $754.4 billion. Of the total AUM, fixed income constituted 56%, equity 25%, liquidity 10% and alternatives represented 9%.
Further, AUM descended 3.7% sequentially from $755.4 billion as of Sep 30, 2018, impacted by a negative market performance and other of $30 billion, long-term outflows of $8.5 billion and $0.2 billion in realizations. These were partly countered by liquidity inflows of $10.5 billion.
Notably, long-term net outflows of $8.5 billion included equity outflows of $3.3 billion, fixed income outflows of $5.1 billion and alternative outflows of $0.1 billion.
Additionally, average AUM was $739.3 billion compared with $759.9 billion witnessed in the prior-year quarter, and $750.2 billion in the previous quarter.
Strong Balance Sheet
As of Dec 31, 2018, Legg Mason had $835.2 million in cash. Total debt was $2.2 billion. Shareholders’ equity came in at $3.7 billion.
The ratio of total debt to total capital (total equity plus total debt excluding consolidated investment vehicles) was 38%, up from 37% witnessed in the prior quarter.
Our Viewpoint
We believe Legg Mason has the potential to outperform its peers over the long run, given its diversified product mix and leverage in the changing market demography. In addition to these, with strategic acquisitions, restructuring initiatives and cost-cutting measures, we anticipate the company’s operating efficiencies to improve.
Nevertheless, declining revenues and currently, rising expenses remain a key concern. Moreover, lower AUM remains an unfavorable factor.
Legg Mason, Inc. Price, Consensus and EPS Surprise
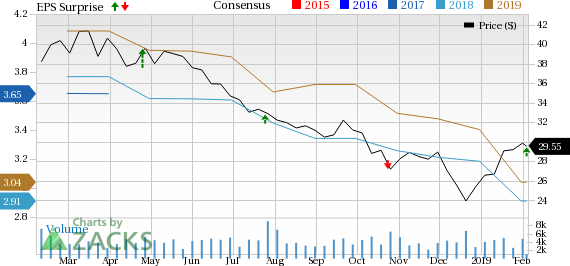
Legg Mason, Inc. Price, Consensus and EPS Surprise | Legg Mason, Inc. Quote
Legg Mason currently carries a Zacks Rank #5 (Strong Sell).
You can see the complete list of today’s Zacks #1 Rank (Strong Buy) stocks here.
Performance of Other Asset Managers
BlackRock, Inc.'s (NYSE:BLK) fourth-quarter 2018 adjusted earnings of $6.08 per share missed the Zacks Consensus Estimate of $6.39. Further, the figure came in 2% lower than the year-ago tally.
Federated Investors, Inc. (NYSE:FII) delivered a positive earnings surprise of 1.7% in fourth-quarter 2018. Earnings per share of 61 cents surpassed the Zacks Consensus Estimate of 60 cents. The figure, however, compared unfavorably with the prior-year quarter earnings of $1.31.
Cohen & Steers’ (NYSE:CNS) fourth-quarter 2018 adjusted earnings came in at 56 cents per share, missing the Zacks Consensus Estimate of 60 cents. However, the bottom line came in 1.8% higher than the year-ago quarter.
Zacks' Top 10 Stocks for 2019
In addition to the stocks discussed above, would you like to know about our 10 finest buy-and-holds for the year?
Who wouldn't? Our annual Top 10s have beaten the market with amazing regularity. In 2018, while the market dropped -5.2%, the portfolio scored well into double-digits overall with individual stocks rising as high as +61.5%. And from 2012-2017, while the market boomed +126.3, Zacks' Top 10s reached an even more sensational +181.9%.
See Latest Stocks Today >>
Cohen & Steers Inc (CNS): Free Stock Analysis Report
Legg Mason, Inc. (LM): Free Stock Analysis Report
BlackRock, Inc. (BLK): Free Stock Analysis Report
Federated Investors, Inc. (FII): Free Stock Analysis Report
Original post
Zacks Investment Research