⭐ Start off 2025 with a powerful boost to your portfolio: January’s freshest AI-picked stocksUnlock stocks

Lead: A Pause, Or Correction?

Published 12/07/2016, 04:42 PM
Updated 07/09/2023, 06:32 AM
MLD
-

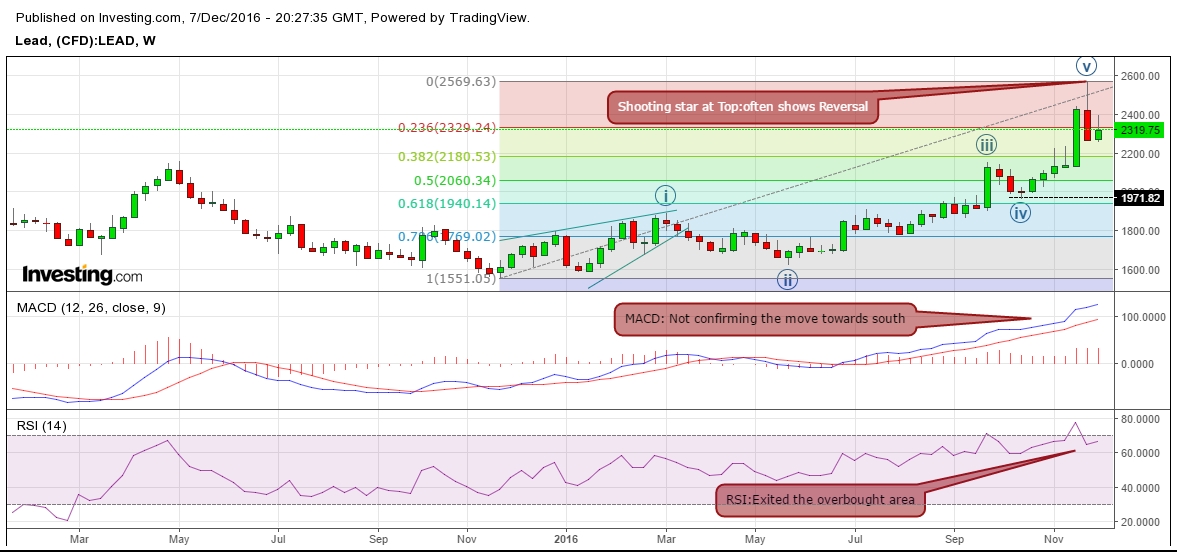
Here is the weekly chart of Lead:
It looks like that lead has completed its first 5 wave structure and now is due for a correction. Most often these candles (Shooting star) when appears on top, reflects complete reversal. RSI has exited from overbought region and trying to find the way towards south whereas MACD is still in buying mode.Lead Weekly Chart

Let's move towards the daily chart for some more clue for upcoming direction.


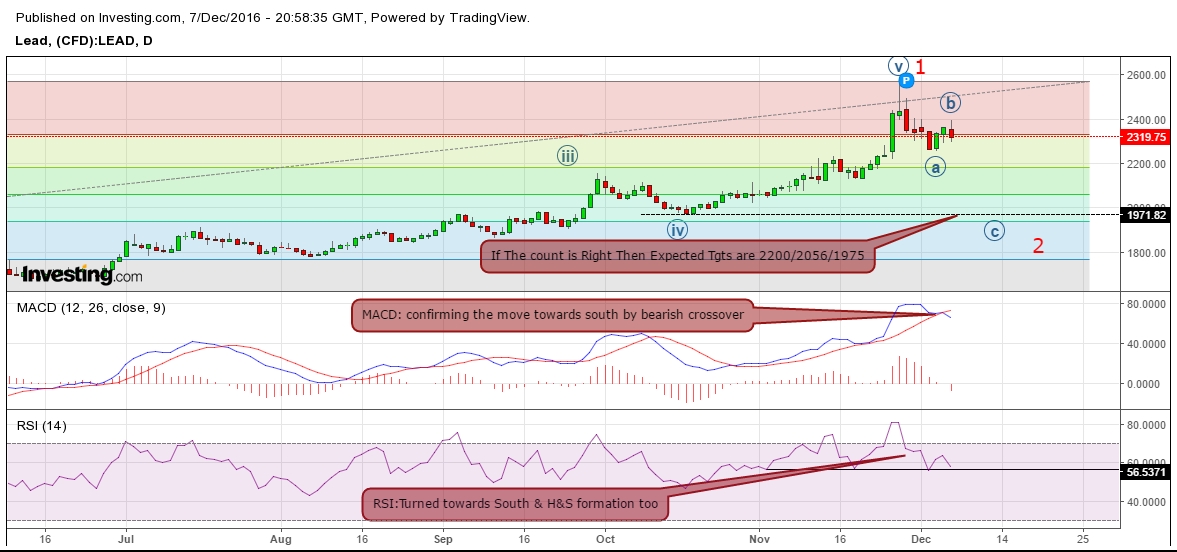
Here is the daily chart of Lead: If my primary counts are right then we are now in corrective (a,b,c) phase. MACD and RSI both are indicating for a move towards south and as we know that most probable target / support zones of corrective waves are the wave (IV) of a lesser degree wave count, 1970 area in this case which sits just above 61.8% retracement of entire bull move from 1581 to 2571.75. Lets move towards a more lower time frame to be more specific about structure.

Lead Daily Chart

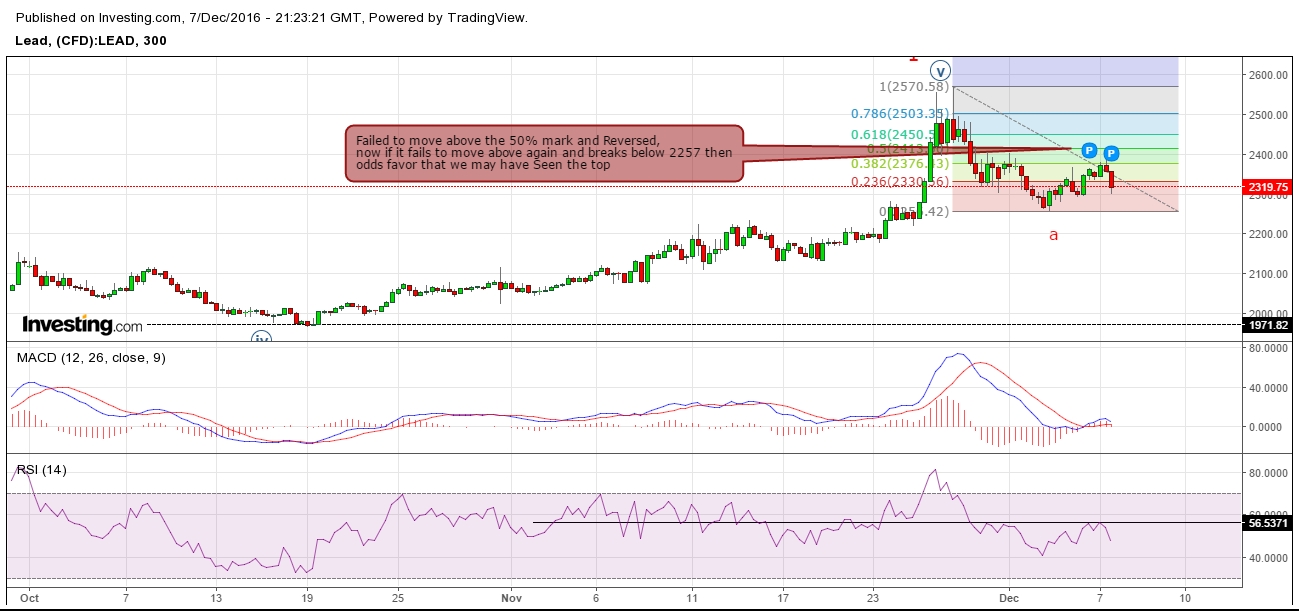
Here is the 5 hr chart of lead, any break below 2257 will be a further indication of a correction for the potential down move up to 1975 area.
Right now we are with bears with a price objective of 2200 followed by 2056 and 1975 with strict stops above 2572. Whether i am right or wrong will be confirmed by the market action in next few days. any move below 2257 will add more confidence to bears whereas the move above 2415 will open the gate for 2450 and 2500 levels which seems unlikely right now.

Lets see what happens next.

Lead 5 Hr Chart

Resistance: 2415/2450/2505
Support : 2246/2125/1970

Latest comments

Loading next article…
Risk Disclosure: Trading in financial instruments and/or cryptocurrencies involves high risks including the risk of losing some, or all, of your investment amount, and may not be suitable for all investors. Prices of cryptocurrencies are extremely volatile and may be affected by external factors such as financial, regulatory or political events. Trading on margin increases the financial risks.
Before deciding to trade in financial instrument or cryptocurrencies you should be fully informed of the risks and costs associated with trading the financial markets, carefully consider your investment objectives, level of experience, and risk appetite, and seek professional advice where needed.
Fusion Media would like to remind you that the data contained in this website is not necessarily real-time nor accurate. The data and prices on the website are not necessarily provided by any market or exchange, but may be provided by market makers, and so prices may not be accurate and may differ from the actual price at any given market, meaning prices are indicative and not appropriate for trading purposes. Fusion Media and any provider of the data contained in this website will not accept liability for any loss or damage as a result of your trading, or your reliance on the information contained within this website.
It is prohibited to use, store, reproduce, display, modify, transmit or distribute the data contained in this website without the explicit prior written permission of Fusion Media and/or the data provider. All intellectual property rights are reserved by the providers and/or the exchange providing the data contained in this website.
Fusion Media may be compensated by the advertisers that appear on the website, based on your interaction with the advertisements or advertisers.
© 2007-2025 - Fusion Media Limited. All Rights Reserved.