Introduction
In the winter of 2008, I was teaching at the University of Palermo (UP) in Buenos Aires. We were in a tall building overlooking the port and I noted an excess of ships in the harbor. It turned out this was happening all over the world because the letters of credit written by banks for cargo were not being accepted by other banks. It was the beginning of what became the largest downturn since 1929.
In the following year, I got my UP students to write essays on how the major Latam countries were coping with the downturn. At that time, the countries could be placed in three groups: Chile, Mexico and Peru coping well, Brazil and Columbia were coping OK while Argentina, Ecuador, and Venezuela were having real problems. At the time, I said the following about Brazil:
Brazil is well on its way to becoming one of the strongest world economies. With a low population density (22.5 persons/sq. km) versus China (141.7) and India (380.0), and abundant natural resources, the future is bright.
So much for the accuracy of my predictions. In the following paragraphs, I look at the economic prospects for these countries from a 2016 perspective.
Growth Rates
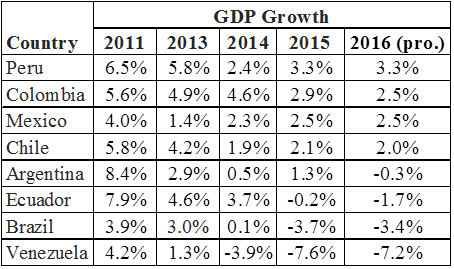
Table 1 provides real GDP growth rates for selected Latam countries ranked by their projected 2016 growth rates. Three countries – Brazil, Ecuador, and Venezuela — are in dire straits for reasons documented below. As I have suggested in a recent piece, there is renewed hope in Argentina: while the consensus forecasters of FocusEconomics are quite bullish on the country in 2017, they believe 2016 will be slow as “resource allocation adjustments” are made.
Table 1. – Real GDP Growth Rates, Selected Latam Countries
Source: FocusEconomics
In the following paragraphs, the reasons for these growth rate projections are examined.
Exports
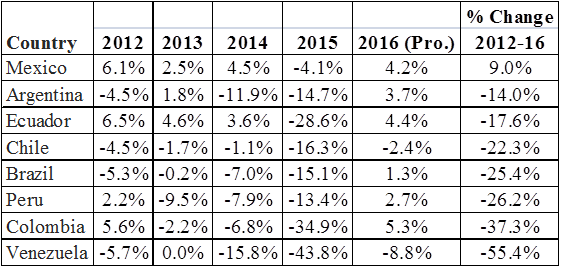
Consider next the export performance of Latam countries (Table 2). There are several factors at play here among which lagging growth rates in China and commodity price declines are probably key.
Table 2. – Percent Change in Exports, Latam Countries
Source: FocusEconomics
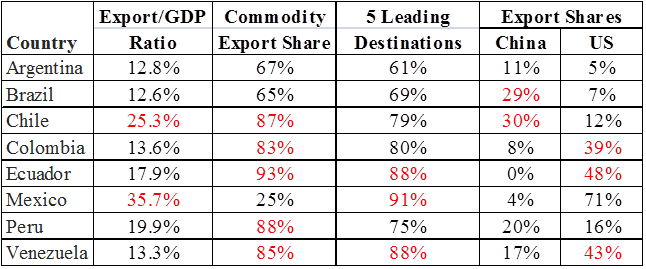
Common wisdom is that the recent economic problems of Latam countries stem from slowing growth in China and the resulting decline in its demand for commodities. Table 3 provides export characteristics data on Latam countries. It suggests that the common wisdom explanation is far from complete. The left hand column indicates how important exports are in each country. They are quite important for Mexico and Chile. The next column indicates the importance of commodity exports. They are very important for 5 countries, less so for Argentina and Brazil. Mexico appears to have the most diverse menu of exports. The next column provides export market concentration – what share of exports goes to the top 5 importing countries. Ecuador, Mexico, and Venezuela sell to a very limited number of countries.
The final two columns indicate the importance of China and the US as importers of Latam countries. China is important for Brazil and Chile but much less so for Argentina. Clearly, not all of Argentine ills can be blamed on lagging Chinese demand. Some might say that because of lagging Chinese demand, countries exporting a large share to the US should be better off. But keep in mind, FocusEconomics estimates China’s GDP growth in 2016 at 6.5% and the US growth at only 2.1%.
Table 3. – Characteristics of Latam Country Exports, 2014
Source: UNCTAD, State of Commodity Dependence, 2014
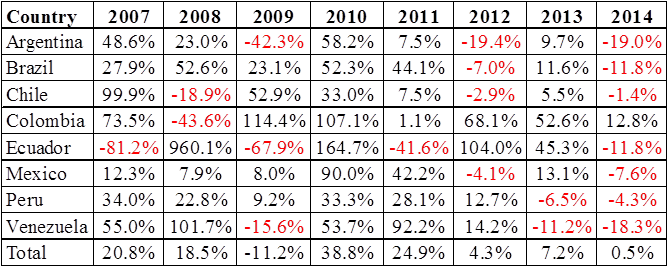
China’s contribution to Latam export changes can be seen in Table 4 where fluctuations in Chinese imports from these countries are presented. Clearly, Argentina, Brazil and Venezuela have been hit pretty hard by recent declines while Ecuador’s exports to China have swung wildly.
Table 4. – Change in Exports to China, 2007-2014 Dollar Values
Source: UNCTAD
Commodities
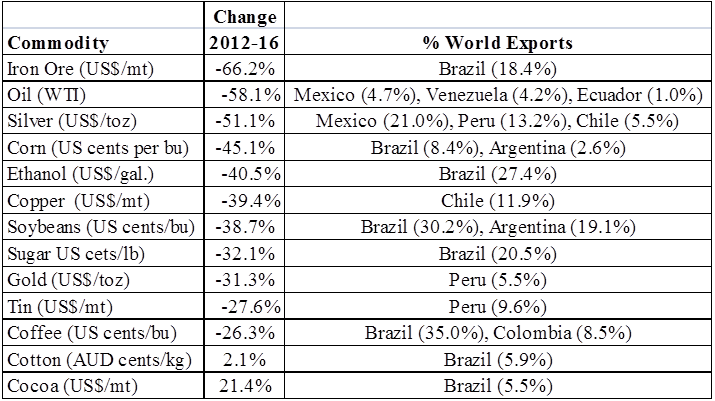
The lagging Chinese demand and other factors generated a dramatic collapse in commodity prices. Table 5 indicates just how serious these declines have been. The right hand column lists the share of world exports for countries covered in this report. Brazil plays and extremely important role in many of these commodities and has understandably been hit hard by the declines. Of course, the other side of this is that with a growing global population, most if not all of these prices will recover.
Table 5. – Commodity Price Changes, 2012 – 2016
Coping
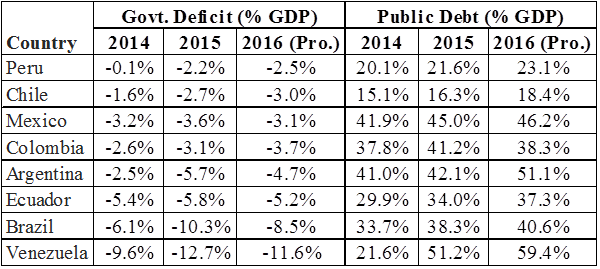
A good test of Latam country strength is how well its government is dealing with these export declines. The decline in exports reduces a country’s income and its government revenues. Table 6 indicates what is happening to government deficits and public debt. By international standards, the debts of these countries are quite low.
On deficits, it appears that Peru, Chile, Mexico, and Peru are doing an okay job of coping. In Argentina, the new President has raised hopes for a turnaround. Ecuador’s problems are exacerbated by the fact that they use the US dollar as its currency. That means the government can literally run out of money. And Ecuador’s international reserves are now down to only 1.5 months of imports.
Brazil is dealing with both severe economic and political problems. Venezuela is a real tragedy. Its proven oil reserves are higher than any country in the world. And despite this, complete government mismanagement has resulted in great economic hardship for its citizens, with a current inflation rate of 200%+.
Table 6. – Public Finances, Latam Countries
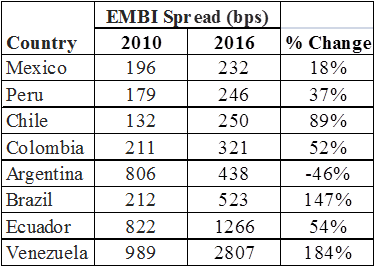
A good indication of how the world views these countries is the Emerging Market Bond Spread (bps): how much more a government has to pay for its debt relative to U.S. Treasuries – 100 bps =1%. Not surprisingly, the Mexican spread is the lowest, reflecting its developed capital markets and its diverse exports. For reasons discussed earlier, Brazil’s spread has risen dramatically. And even with its huge oil reserves, Venezuela’s spread is huge, reflecting a widespread lack of trust in the government.
Table 7. – EMBI Spreads
Source: FocusEconomics
Investments
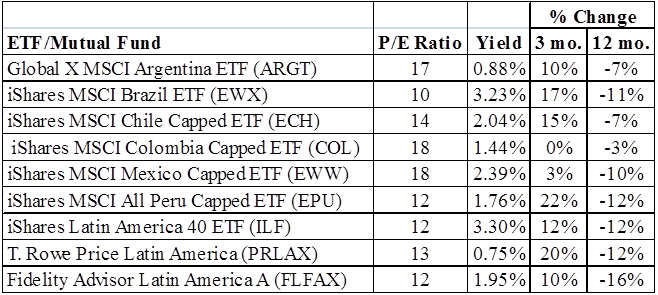
It is well-publicized that all of these countries have been hit by lagging Chinese demand and commodity price declines. There will be a turnaround at some point. So is this the time to consider investing in any of these countries? Table 8 gives a selected listing of ETF and mutual fund investment vehicles. The high P/E ratio for Argentina (via Global X MSCI Argentina (NYSE:ARGT)) suggests the possible turnaround is already reflected in its price. Peru (via iShares MSCI All Peru Capped (NYSE:EPU)) tends to outperform expectations. The conservative investment would be an overall Latin American fund or ETF. The iShares Latin America 40 ETF (NYSE:ILF) has the most attractive yield.
Table 8. – Latam Investment Vehicles
Source: Yahoo Finance
And then there is Brazil (iShares MSCI Brazil Capped (NYSE:EWZ)). Take another look at Table 5 and Brazil’s share of the global exports of the following commodities: Iron Ore – 18.4%, Corn – 8.4%, Ethanol – 27.4%, Soybeans – 30.2%, Sugar – 20.5%, Coffee – 35.0%, Cotton – 5.9%, Cocoa – 5.5%. The demand for all of these commodities will increase as global populations and income rise. And yes, at least for now, Brazil has some very serious political problems.
The iShares Brazil ETF has a 3.23% yield and a low P/E ratio. As a long-term investment, it is worth considering.
