The Fed's new monetary stimulus program announced yesterday (Wednesday) is geared towards shoring up the housing/mortgage market which, they hope, will, in turn, stimulate consumer/corporate/investor confidence and job growth. This has been their intent since they began a variety of monetary stimulus programs in 2008.
In this regard, it may be prudent to monitor the relationship between the financial markets and the SPX, and the housing markets and the SPX, in order to (generally) gauge the strength of market faith in the viability of such an outcome as we go forward over the next year. No doubt, these markets may produce short-term volatile reactions to various economic data points as they are released during this period. What will be of interest is whether any one particular release affects the general trend in such a way as to produce a reversal.
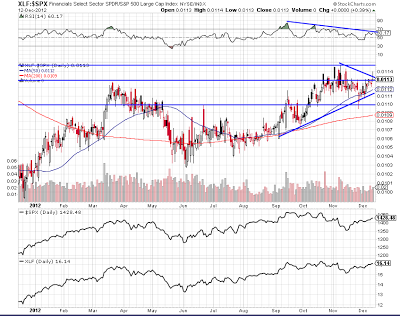
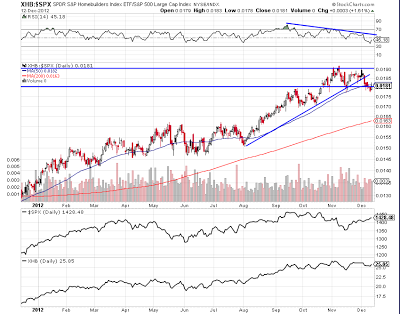
As such, I present the following two Daily ratio charts of the XLF:SPX (Financials ETF) and the XHB:SPX (Homebuilders ETF). At the moment, both the XLF and XHB Sectors are trading weaker compared to the SPX.
The RSI Indicator has been in decline since September of this year. The XHB is relatively weaker compared to the SPX than is the XLF. In the near term, a drop and hold below current support on XHB:SPX, together with a failure to regain and hold above current resistance on XLF:SPX, may lead to a pullback in both of these Sectors.
Furthermore, a drop and hold below the 50 sma (which serves as a support level on the general uptrend) may signal a trend reversal for both Sectors, which could send prices down to the 200 sma...ones to watch over the next weeks and months.

- English (UK)
- English (India)
- English (Canada)
- English (Australia)
- English (South Africa)
- English (Philippines)
- English (Nigeria)
- Deutsch
- Español (España)
- Español (México)
- Français
- Italiano
- Nederlands
- Português (Portugal)
- Polski
- Português (Brasil)
- Русский
- Türkçe
- العربية
- Ελληνικά
- Svenska
- Suomi
- עברית
- 日本語
- 한국어
- 简体中文
- 繁體中文
- Bahasa Indonesia
- Bahasa Melayu
- ไทย
- Tiếng Việt
- हिंदी
Latest Fed Stimulus Viable? 2 ETFs Could Tell The Story
Published 12/13/2012, 12:55 AM
Updated 07/09/2023, 06:31 AM
Latest Fed Stimulus Viable? 2 ETFs Could Tell The Story
Latest comments
Loading next article…
Install Our App
Risk Disclosure: Trading in financial instruments and/or cryptocurrencies involves high risks including the risk of losing some, or all, of your investment amount, and may not be suitable for all investors. Prices of cryptocurrencies are extremely volatile and may be affected by external factors such as financial, regulatory or political events. Trading on margin increases the financial risks.
Before deciding to trade in financial instrument or cryptocurrencies you should be fully informed of the risks and costs associated with trading the financial markets, carefully consider your investment objectives, level of experience, and risk appetite, and seek professional advice where needed.
Fusion Media would like to remind you that the data contained in this website is not necessarily real-time nor accurate. The data and prices on the website are not necessarily provided by any market or exchange, but may be provided by market makers, and so prices may not be accurate and may differ from the actual price at any given market, meaning prices are indicative and not appropriate for trading purposes. Fusion Media and any provider of the data contained in this website will not accept liability for any loss or damage as a result of your trading, or your reliance on the information contained within this website.
It is prohibited to use, store, reproduce, display, modify, transmit or distribute the data contained in this website without the explicit prior written permission of Fusion Media and/or the data provider. All intellectual property rights are reserved by the providers and/or the exchange providing the data contained in this website.
Fusion Media may be compensated by the advertisers that appear on the website, based on your interaction with the advertisements or advertisers.
© 2007-2025 - Fusion Media Limited. All Rights Reserved.
