Gold, silver and the USD Index didn’t do much in earlier this week, but that was not the case with mining stocks. The divergence between gold stocks and gold was particularly visible and the implications are once again particularly important.
Let’s take a look at the charts, starting with the HUI Index.

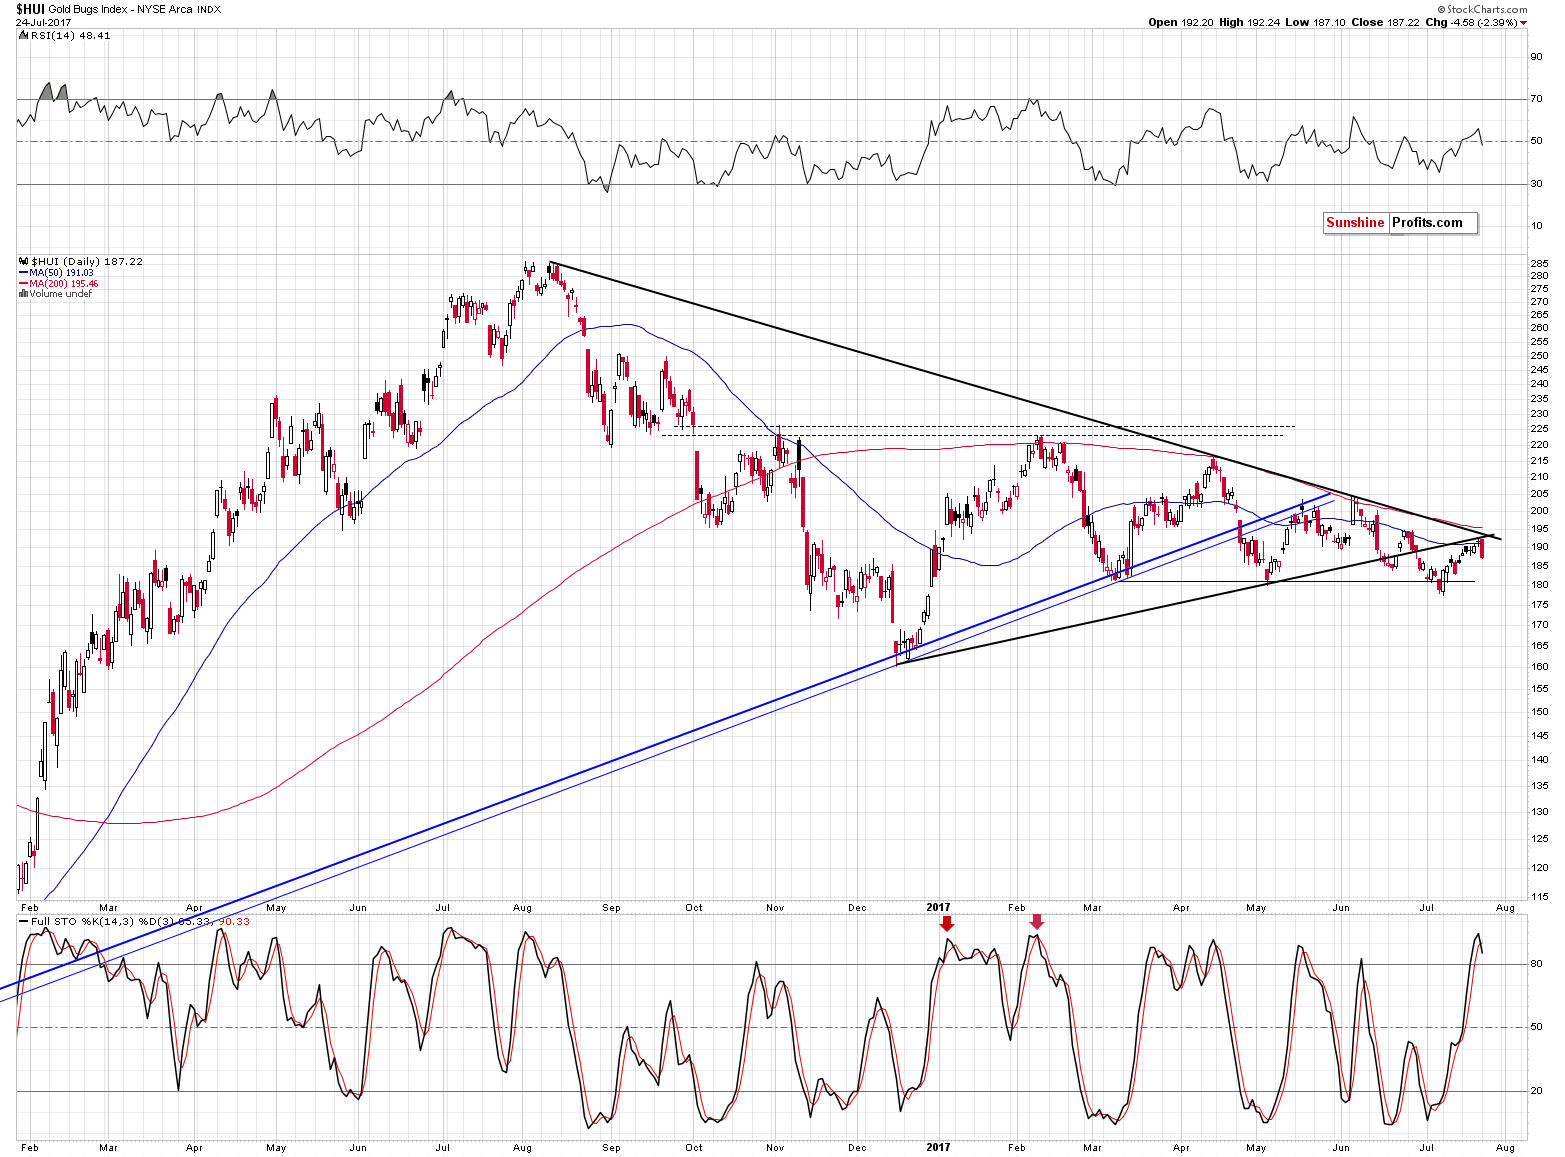
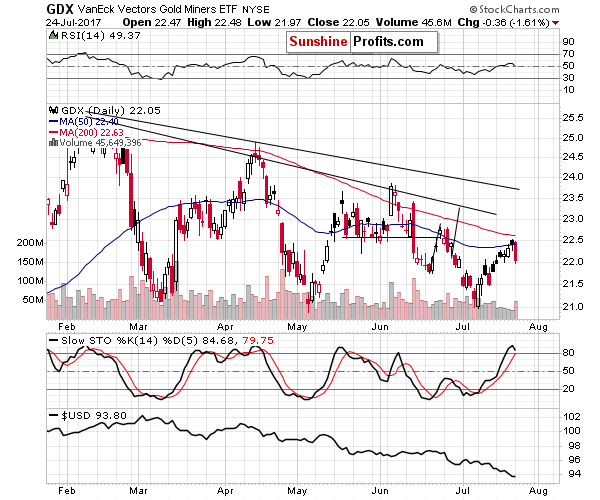
The gold stocks’ reaction to the recent USD weakness and gold’s previous move higher has been weak for many days, but Monday’s session took the weakness to the extreme. Gold ended the session more or less unchanged and this lack of a continuation of the rally was enough for the HUI Index to erase almost the entire previous week of gains.
This could have been understandable if the general stock market had also declined substantially, pushing all stocks – including miners – much lower. However, that was not the case. Miners had no good reason to decline – and yet they did. It doesn’t get much clearer than that as far as the degrees of underperformance and weakness are concerned.
Please note that gold stocks declined right after the move to the combination of strong resistance lines and their reversal triggered a sell signal from the Stochastic Indicator. The implications are clearly bearish.

If the above wasn’t enough, the decline took place on big volume, while the previous daily upswings took place on low volume. The price-volume analysis clearly confirms that the July upswing was a counter-trend correction and that down is the true direction in which the market is heading.
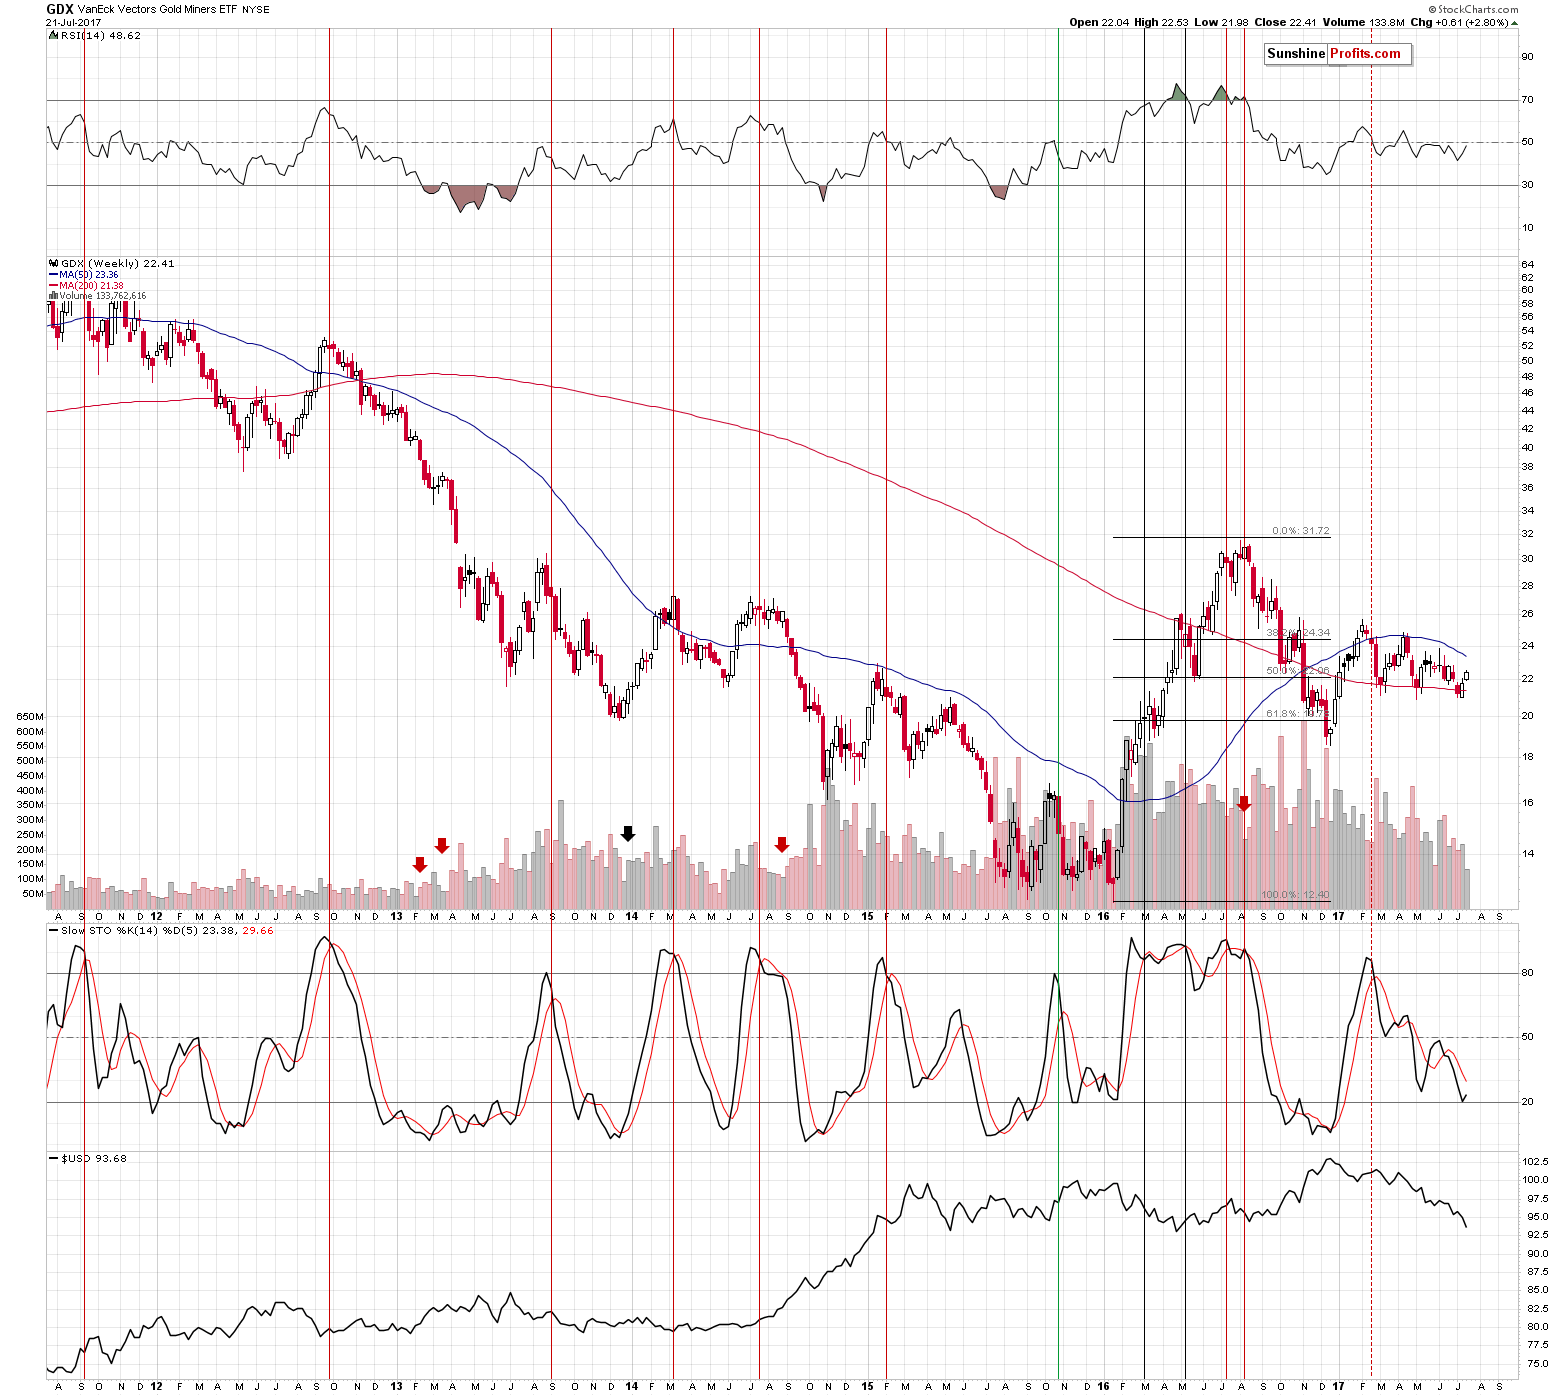
Let’s keep in mind that the additional significant confirmation comes from the weekly volume readings (the text below is a quote from yesterday’s Gold Trading Alert), but it’s impact is present – and it will likely continue to be present in the following weeks:

The volume that we saw last week was extremely low, especially when compared to the sizes of previous volumes. Theoretically, it’s a strong bearish sign as it shows that the buying power is next to non-existent.
We marked similar situations with red arrows – as you see, the weekly upswings that took place on very low volume were usually followed by huge declines. The only exception that we can see on the above chart (1 out of 5) is not quite comparable as it was the session right at the bottom and the current one is the second after the bottom, which changes a lot – the volume should be picking up right now, but it isn’t. Back in December 2013 it was the first candlestick of the rally – so the sellers might have given up and the buyers simply were able to push the market higher. Besides, trading is generally limited in the second half of December each year as it’s the holiday season.
So, it seems that in all comparable cases, huge declines followed the low-volume rallies in mining stocks – will this time be any different? It doesn’t seem likely. The efficiency of this signal alone is something that makes the outlook very bearish for the following weeks.
