This week's trading in the SPY with pre-market activity. Vertical blue dash line is the regular trading hour open, fuchsia horizontal lines are the overnight highs/lows.
Monday - Trend day from the beginning. Notice how the first 5-minute bar cut right through the o/n lows and didn't look back, making it difficult to enter if looking to short a pullback.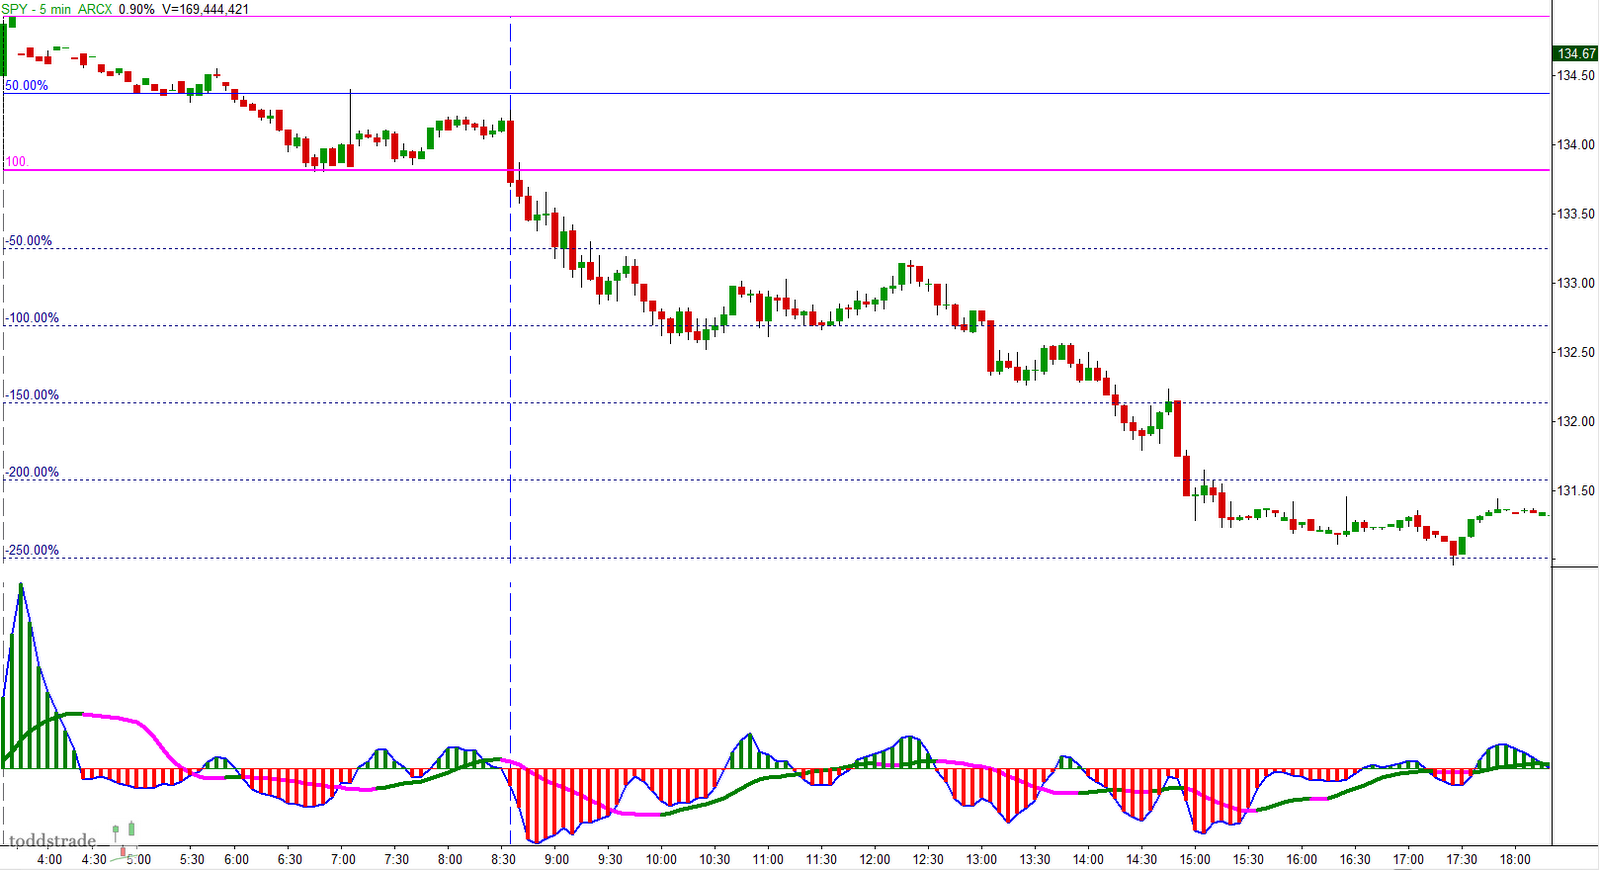
Tuesday - A false breakdown of the o/n lows leading to a squeeze in the other direction. Support at the o/n highs eventually holding and extending into the 150% projection.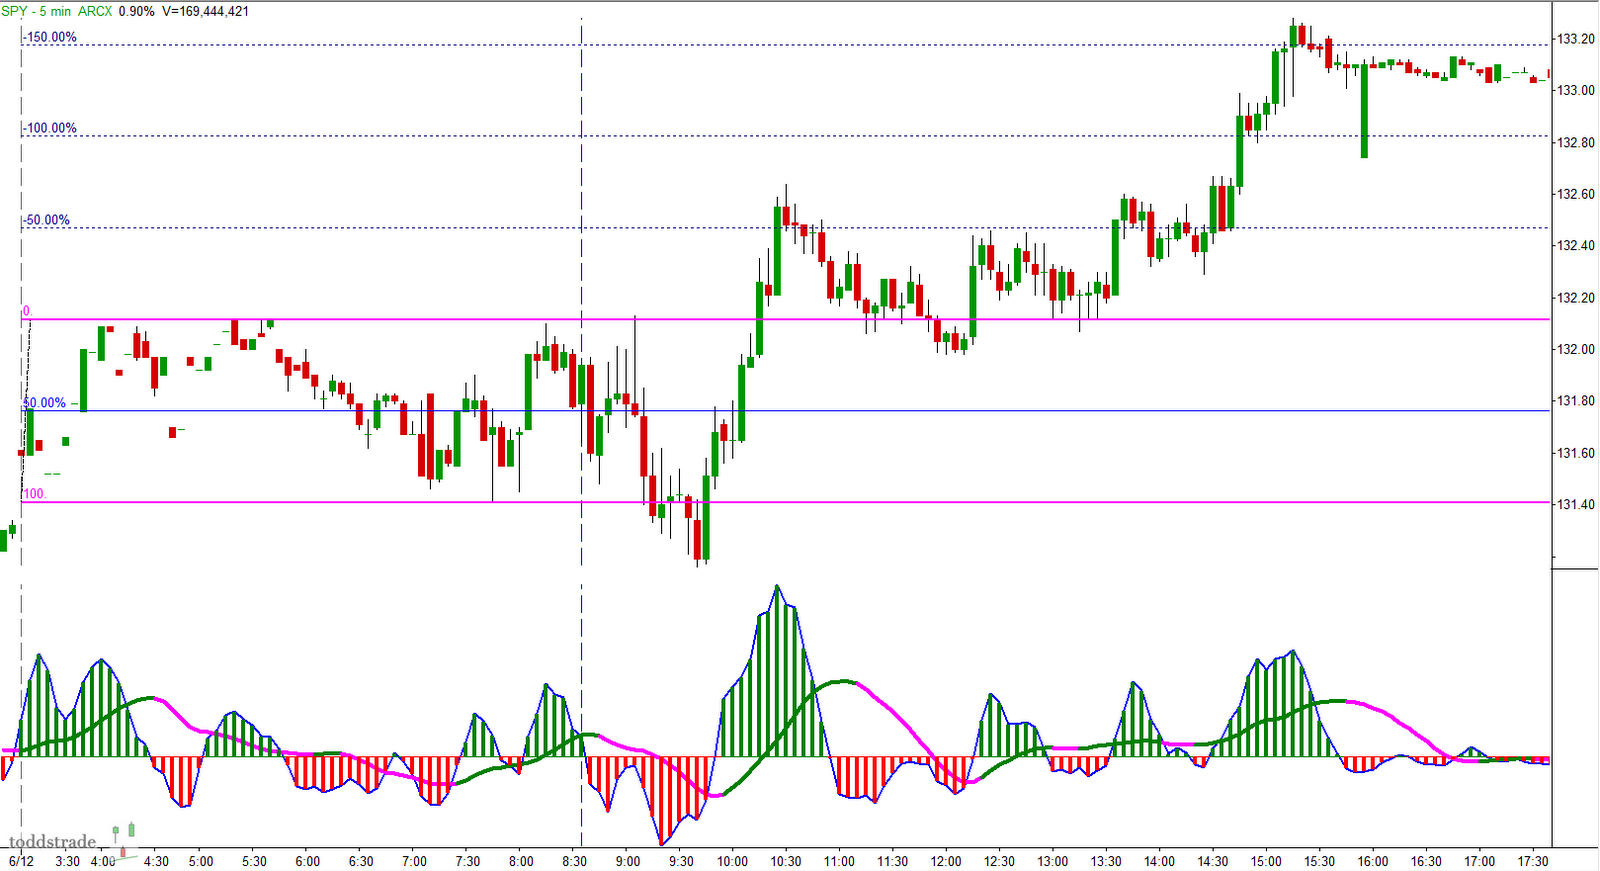
Wednesday - Price holding the o/n lows, attempting to break the o/n highs and eventually selling off down to the 50% projection.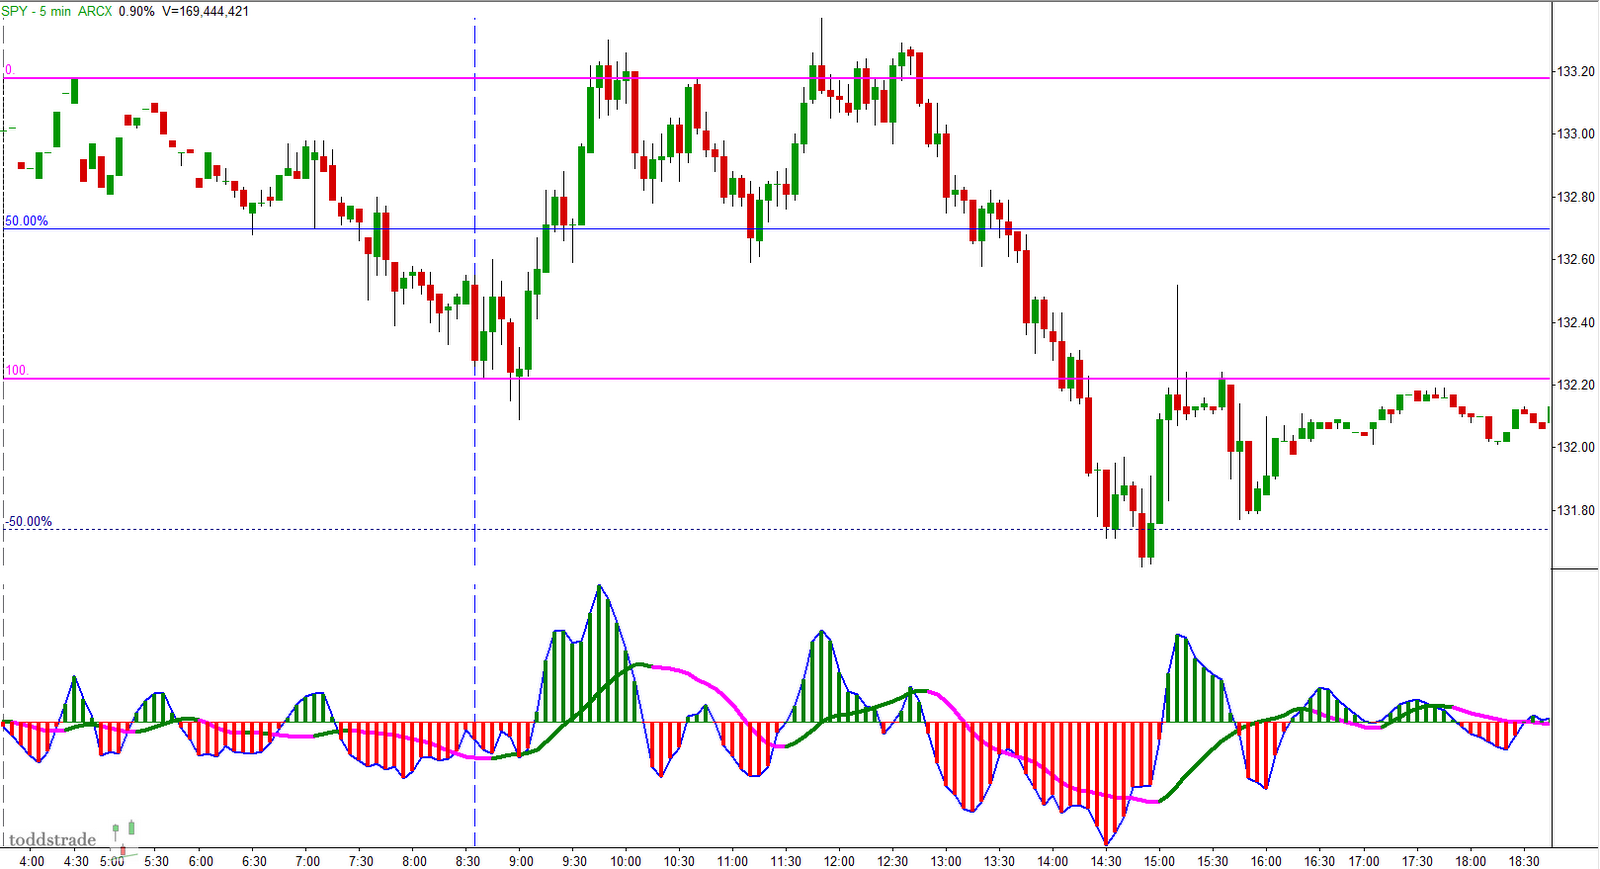
Thursday - A narrower o/n range with an early breakout to an eventual tag of the 100% projection. Late afternoon pullback coming very close to the o/n high and extending higher on extreme volatility.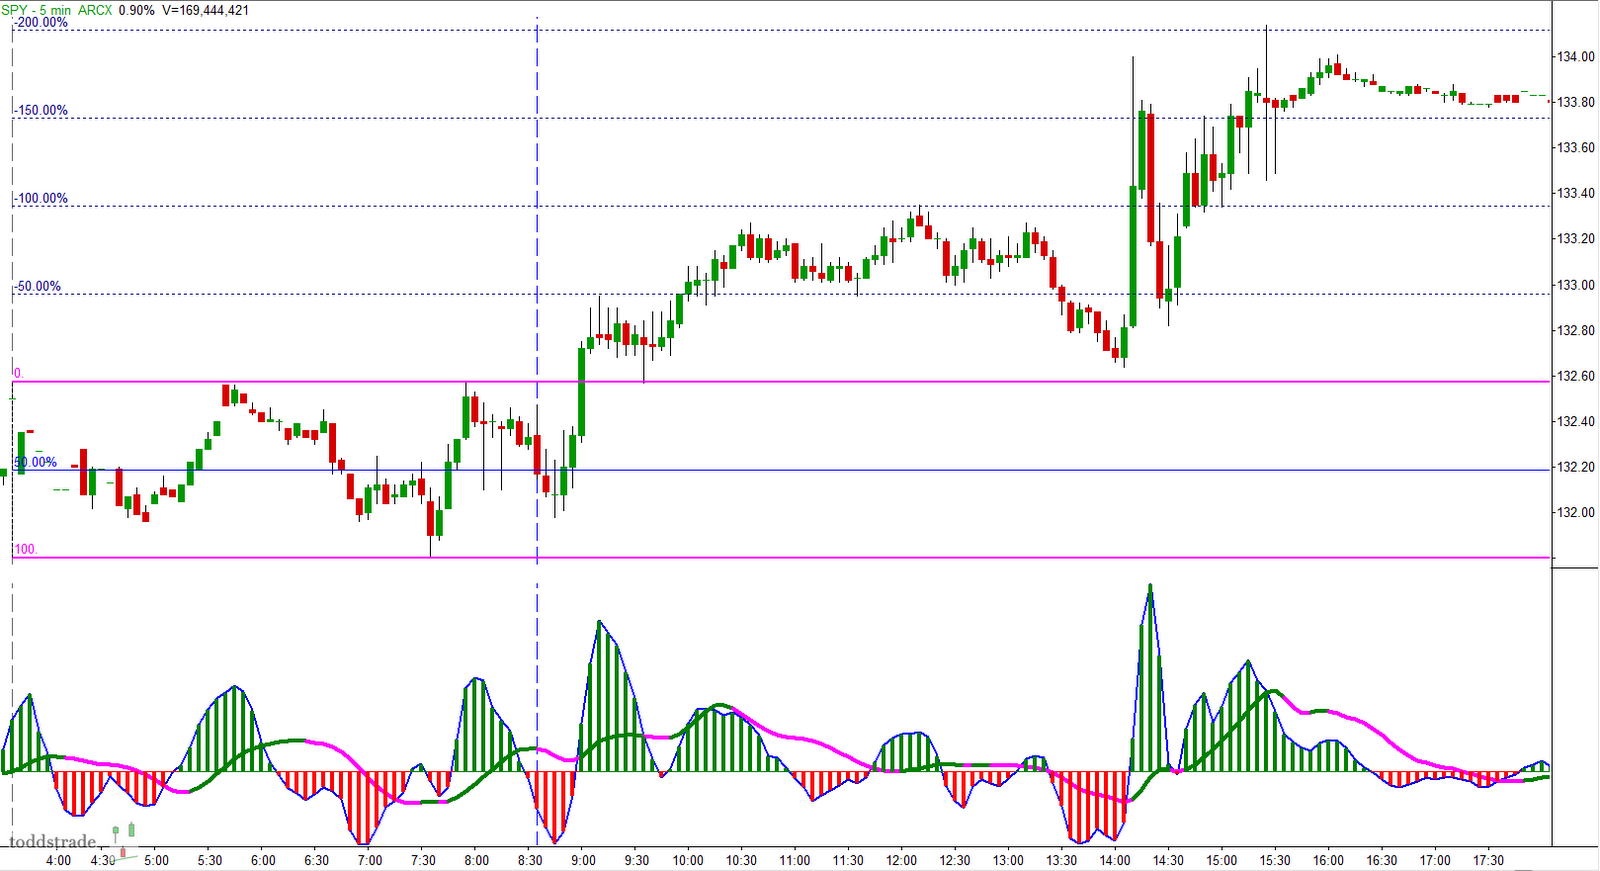
Friday - o/n lows hold and move higher throughout the day.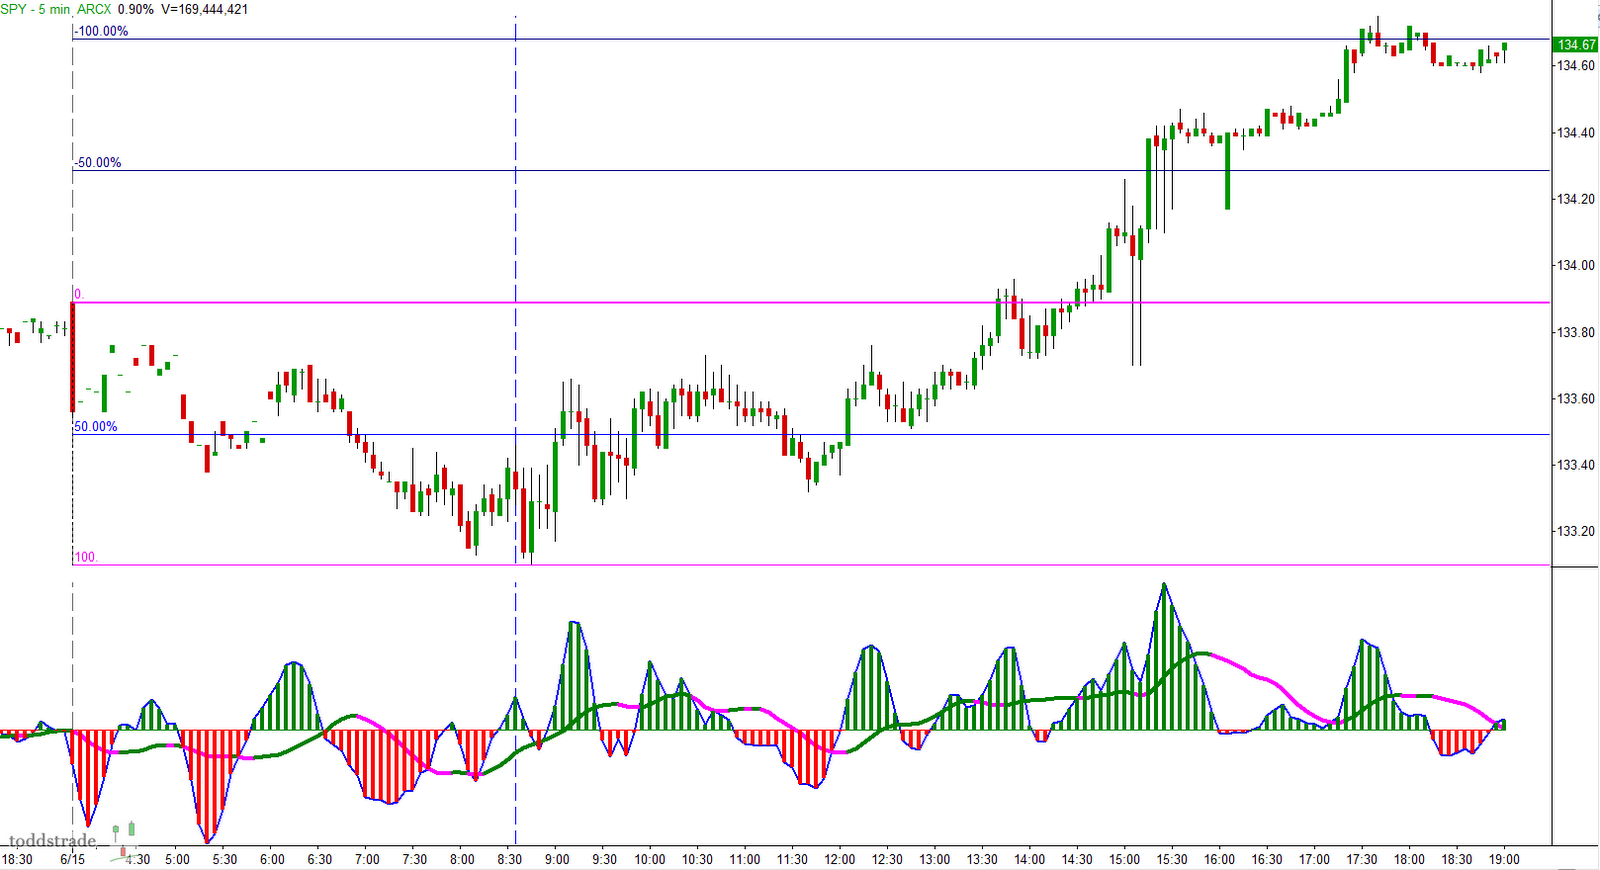
- English (UK)
- English (India)
- English (Canada)
- English (Australia)
- English (South Africa)
- English (Philippines)
- English (Nigeria)
- Deutsch
- Español (España)
- Español (México)
- Français
- Italiano
- Nederlands
- Polski
- Português (Portugal)
- Português (Brasil)
- Русский
- Türkçe
- العربية
- Ελληνικά
- Svenska
- Suomi
- עברית
- 日本語
- 한국어
- 简体中文
- 繁體中文
- Bahasa Indonesia
- Bahasa Melayu
- ไทย
- Tiếng Việt
- हिंदी
Last Week In SPY
Published 06/17/2012, 01:54 AM
Updated 07/09/2023, 06:31 AM
Last Week In SPY
Latest comments
Loading next article…
Install Our App
Risk Disclosure: Trading in financial instruments and/or cryptocurrencies involves high risks including the risk of losing some, or all, of your investment amount, and may not be suitable for all investors. Prices of cryptocurrencies are extremely volatile and may be affected by external factors such as financial, regulatory or political events. Trading on margin increases the financial risks.
Before deciding to trade in financial instrument or cryptocurrencies you should be fully informed of the risks and costs associated with trading the financial markets, carefully consider your investment objectives, level of experience, and risk appetite, and seek professional advice where needed.
Fusion Media would like to remind you that the data contained in this website is not necessarily real-time nor accurate. The data and prices on the website are not necessarily provided by any market or exchange, but may be provided by market makers, and so prices may not be accurate and may differ from the actual price at any given market, meaning prices are indicative and not appropriate for trading purposes. Fusion Media and any provider of the data contained in this website will not accept liability for any loss or damage as a result of your trading, or your reliance on the information contained within this website.
It is prohibited to use, store, reproduce, display, modify, transmit or distribute the data contained in this website without the explicit prior written permission of Fusion Media and/or the data provider. All intellectual property rights are reserved by the providers and/or the exchange providing the data contained in this website.
Fusion Media may be compensated by the advertisers that appear on the website, based on your interaction with the advertisements or advertisers.
© 2007-2024 - Fusion Media Limited. All Rights Reserved.
