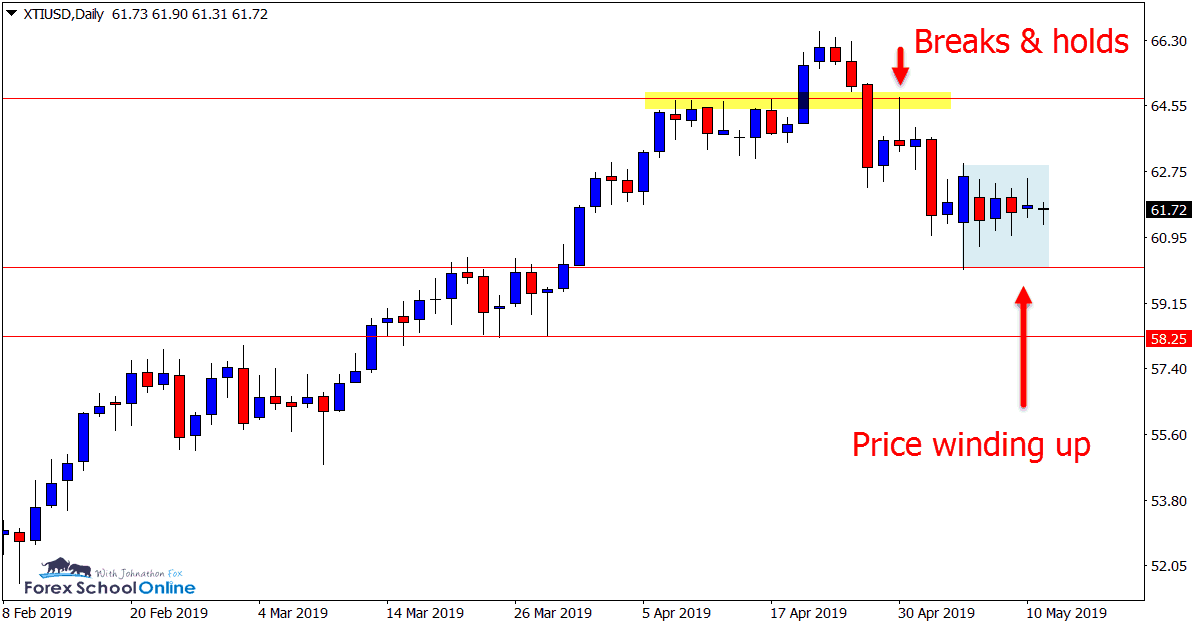
AUD/NZD Daily Chart
- Large Bearish Pin Bar
Price on the daily chart of the AUD/NZD has fired off a large bearish pin bar reversal.
Whilst this is a large reversal candle and is rejecting a solid resistance, it would have been nice to see it form a little higher up at a swing high, sticking away from other price action and through the resistance.
If the pin bar was formed higher and right up at a swing high it would create a setup with a lot more room for price to break lower into and a lot more reward potential. It would also be faking out a lot more of the market with price moving up above the resistance and then snapping back below.
Below is the second chart I have created an example chart of how this could have looked and why it would have been a better scenario.
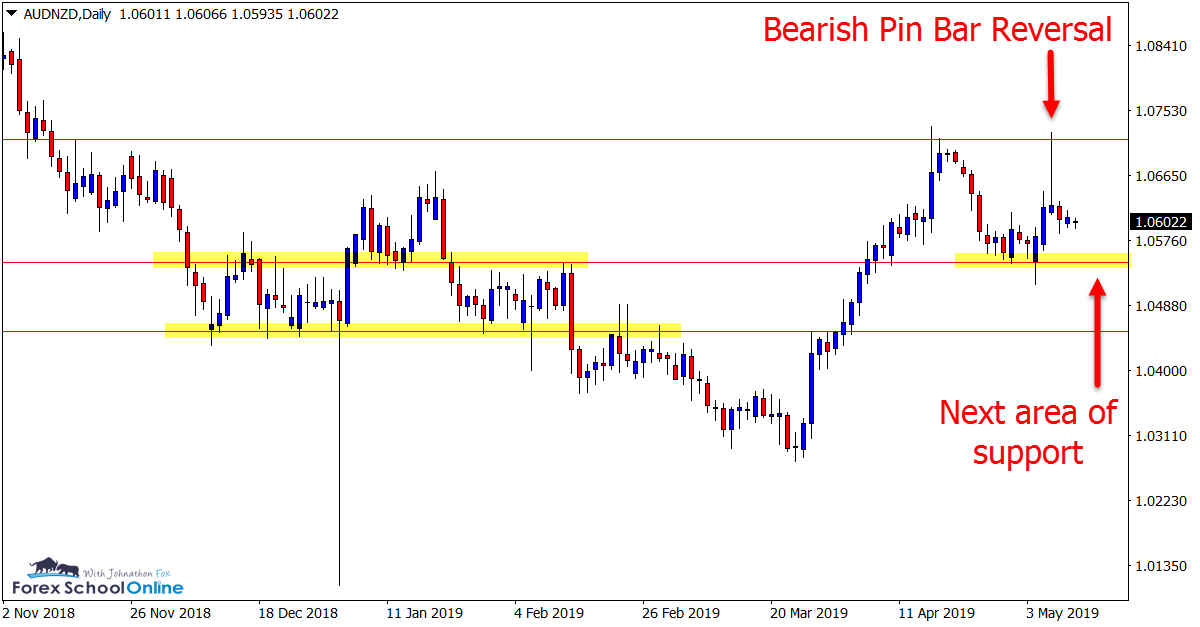
Daily Chart – “Example Chart”
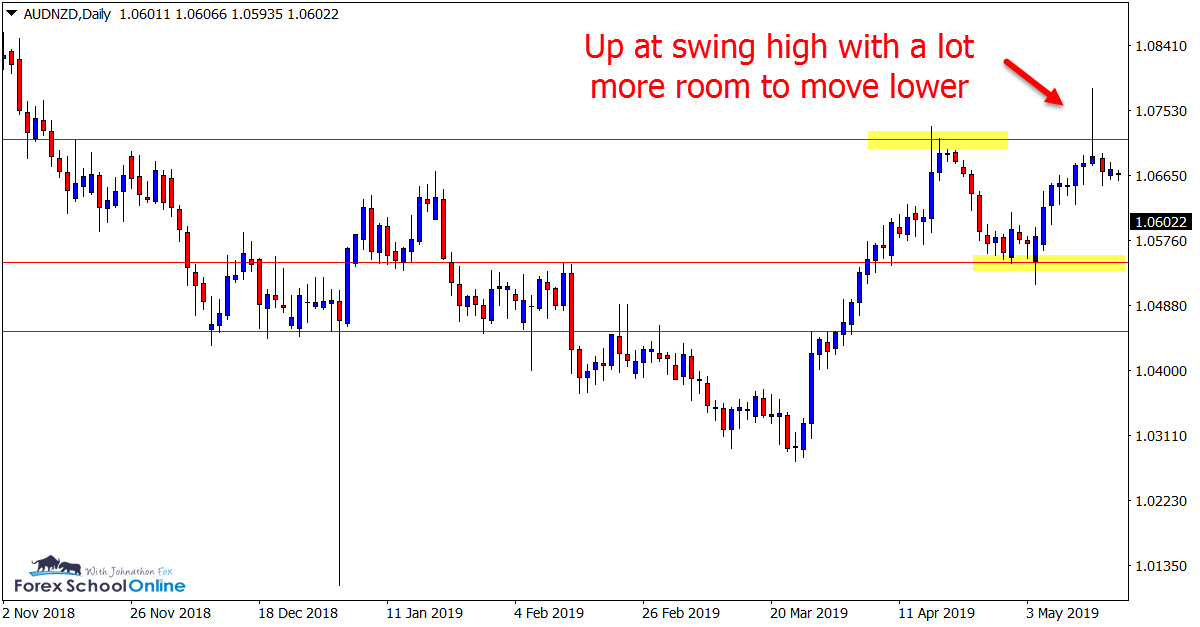
GBP/JPY Daily and 15 Minute Charts
- Fast Break and 15 Min Chart Pin Bar
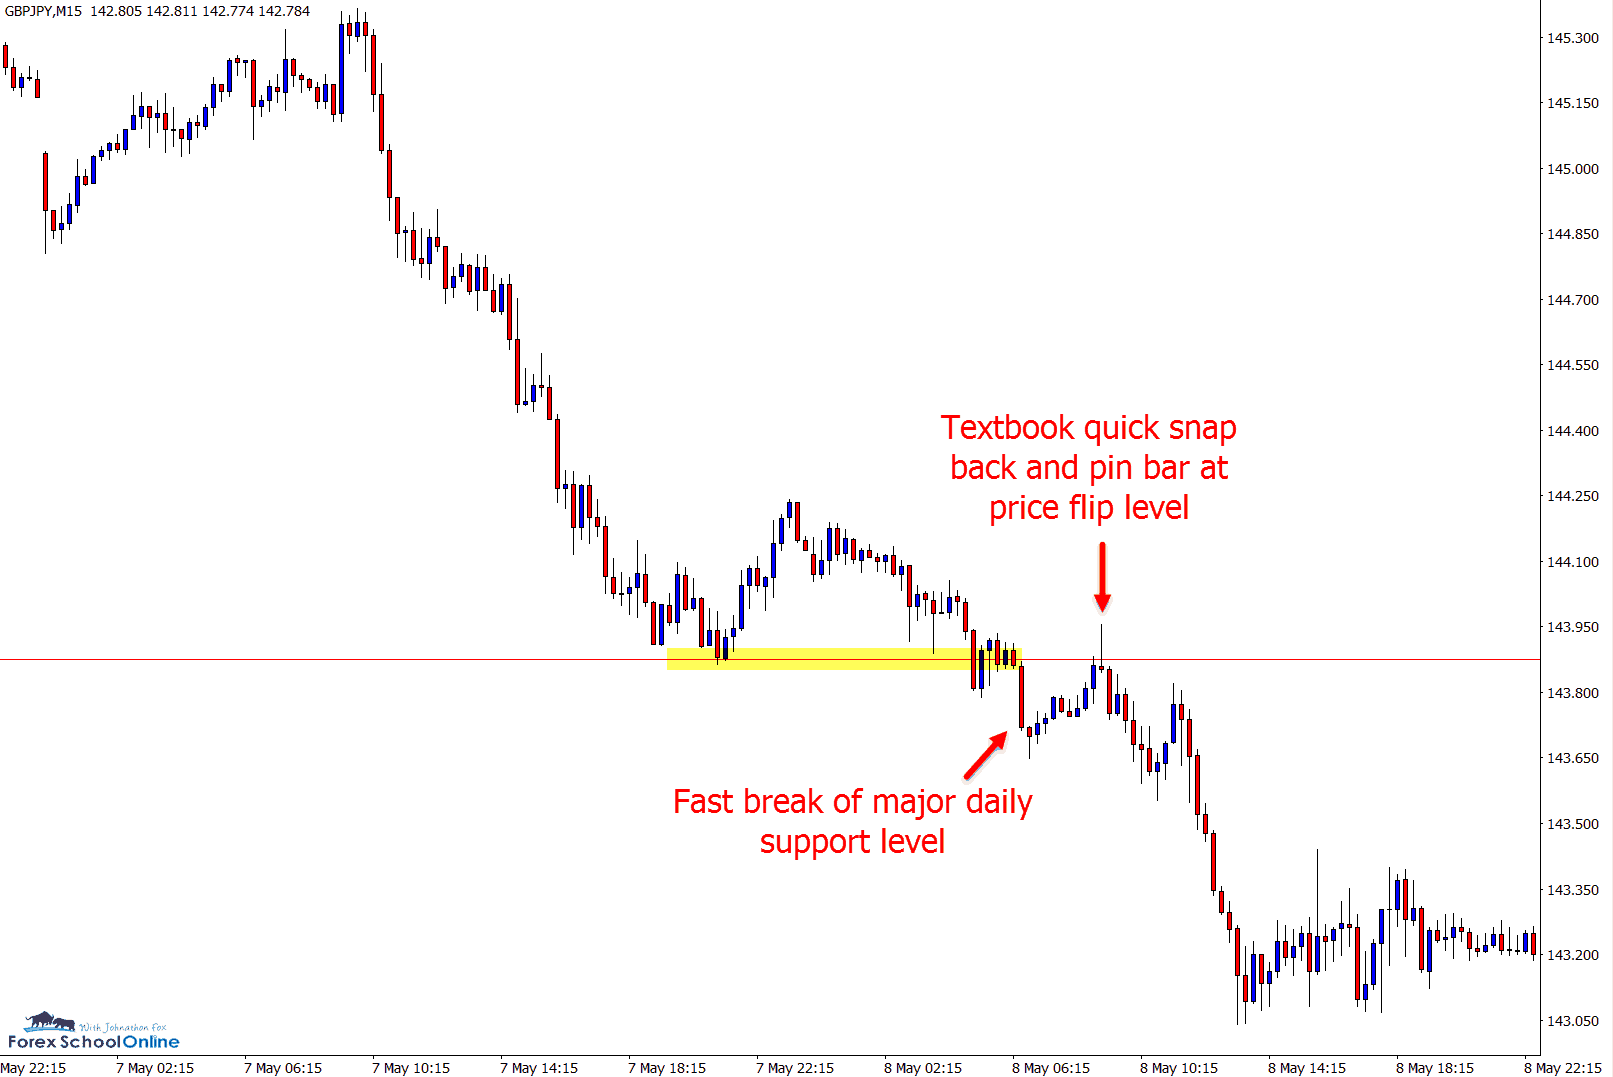
We have been waiting for the quick breakout and re-test trade setups in this pair for the last couple of weeks and finally, price broke the major daily support.
Slamming lower and through the proven support level, the price quickly retraced back higher and into the old support / new resistance. Price formed a 15-minute chart pin bar at this level and quickly continued on with the move lower to now be resting on the next daily chart support.
When we see price stall and unable to break a level for as long as the GBP/JPY did, the eventual breakout will often be explosive like we have seen here.
Price has now paused. Bearish traders could look to see if price retraces again back into the same price flip and fires off any A+ price action triggers.
BITCOIN Daily and 4 Hour Charts
- Price Slams Through Major Resistance
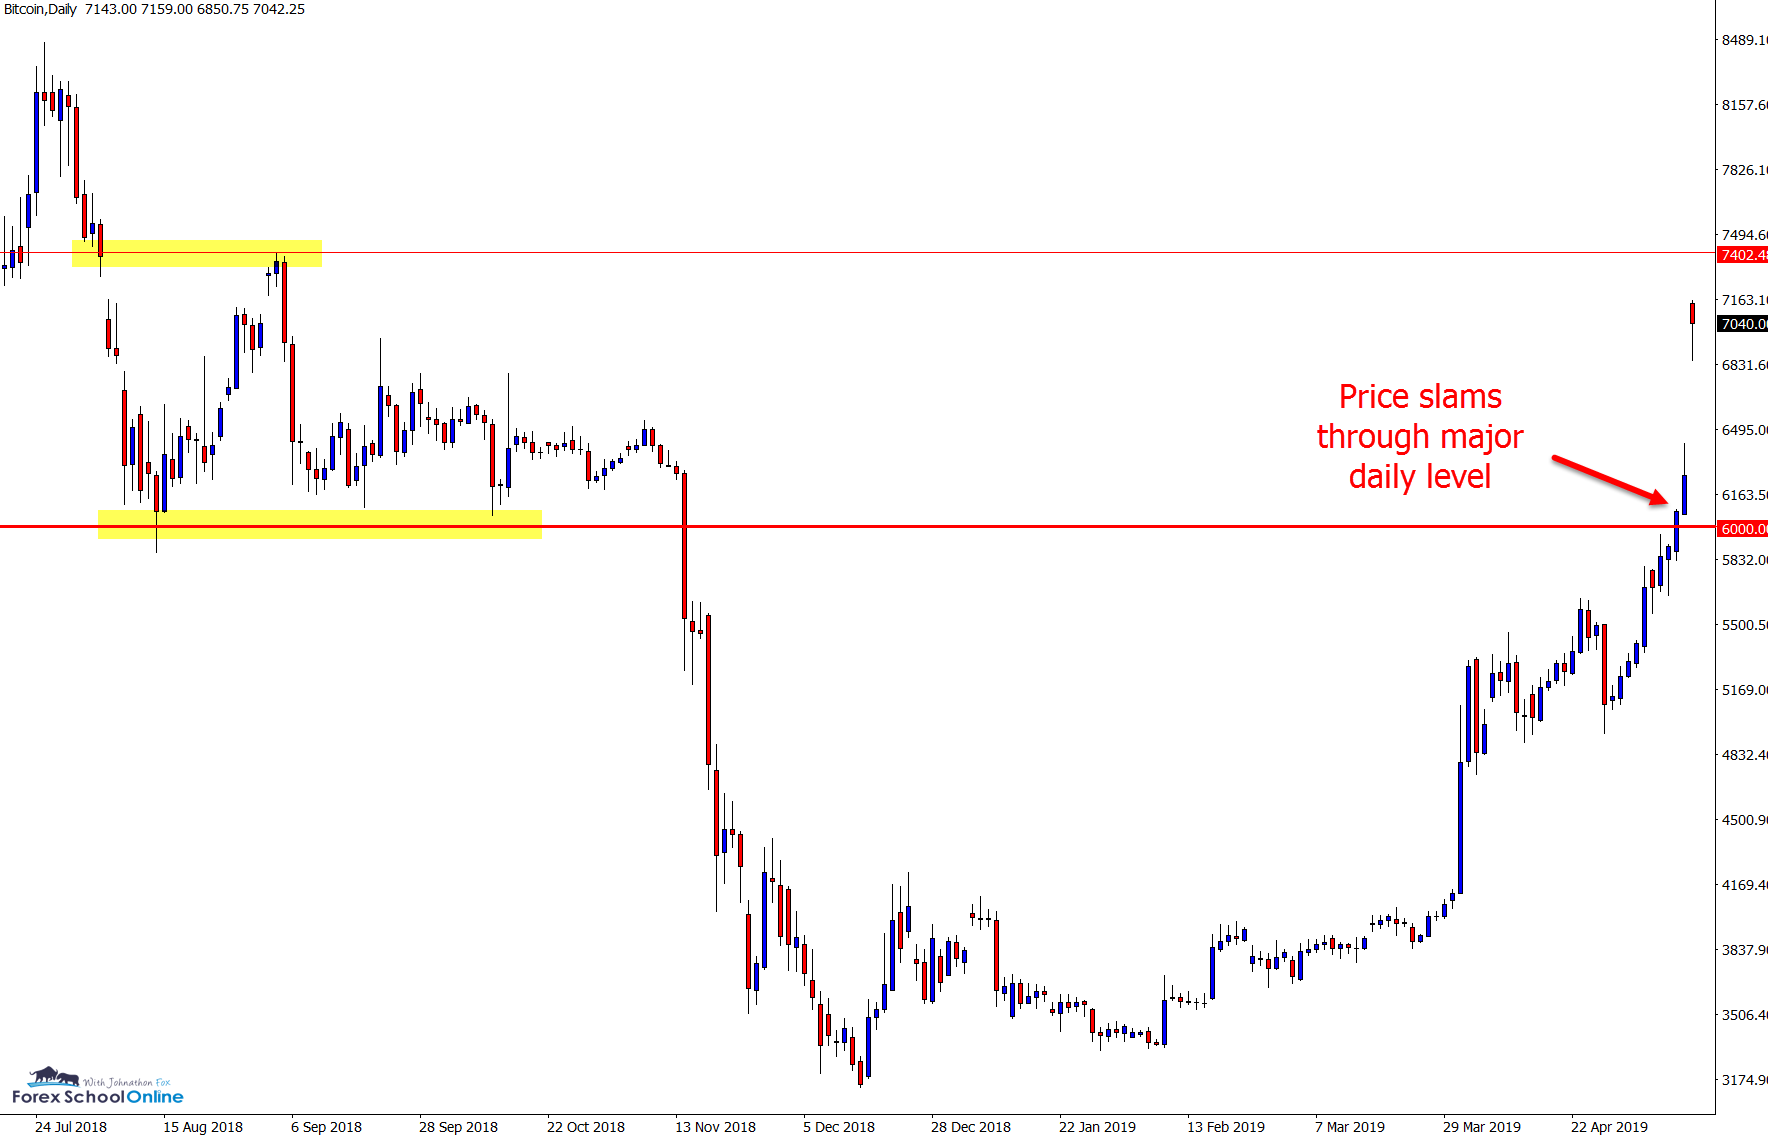
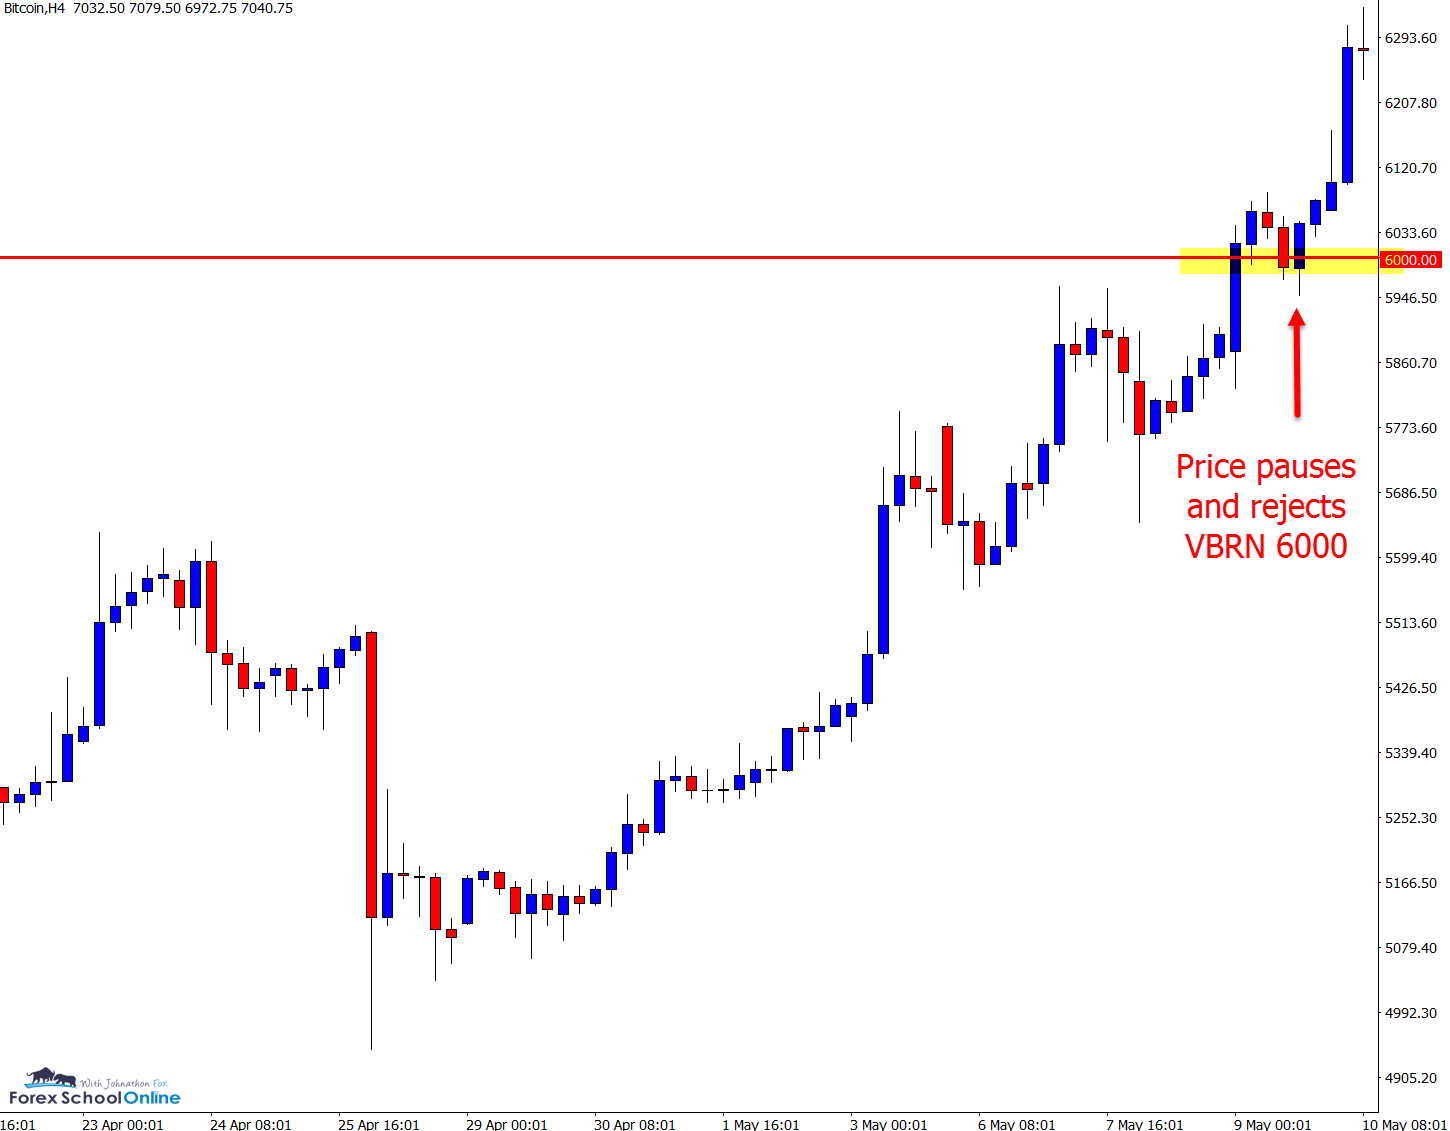
In last week’s midweek trade ideas we discussed this market and the major level at 6000 price was about to move into and make a test of.
Price slammed through this level, made a quick pause and re-test on the 4-hour chart and then has exploded higher.
We can now see the next major test for this runaway move looks to be around the 7400 area.
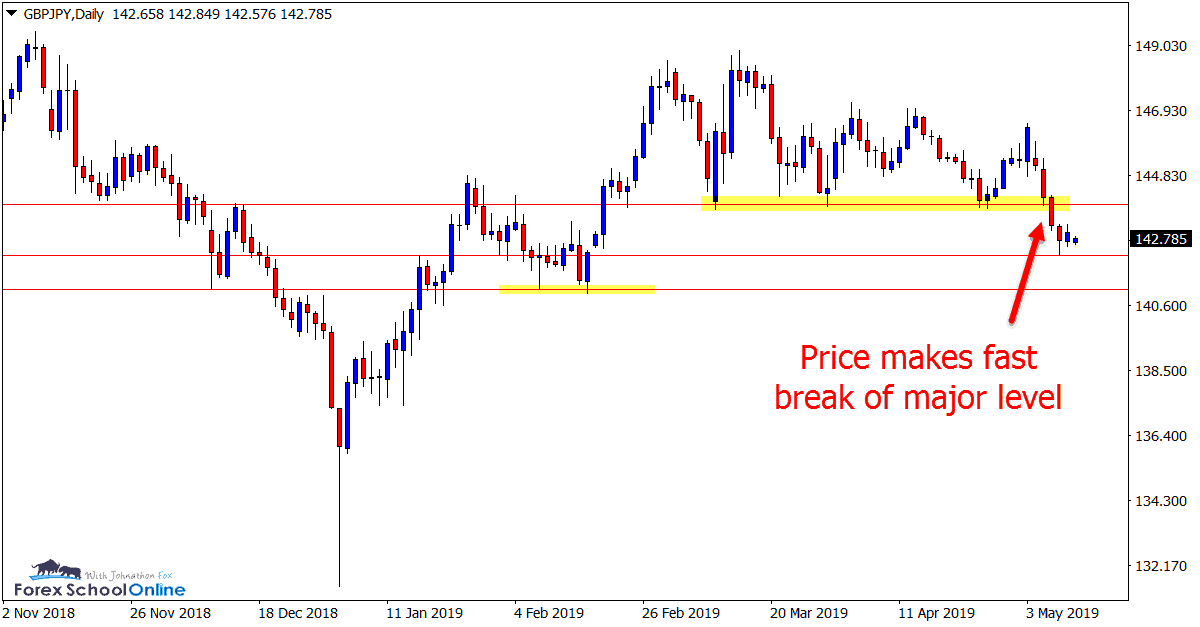
Oil Daily Chart
- Potential Market Reversal in Play
This is another market we have been charting and watching closely in recent times with a possible reversal back lower in play.
We can see on the daily chart that price has snapped below the major level and rejected it as resistance once again.
Price is now winding up and stalling sideways preparing for its next decisive move either way.
Whilst the overhead resistance is crucial for the bulls trying to push higher, if the support level that price is now sitting on gives way, then we could get a new trend lower and see it open the way for a lot of potential short trades.
