
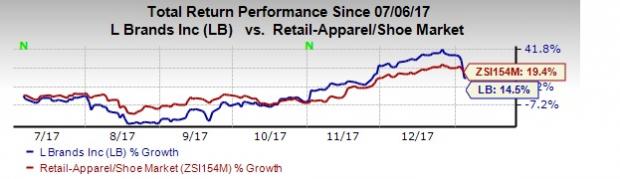
Despite positive comparable sales for the month of December, L Brands, Inc. (NYSE:LB) shares tanked 12.3% yesterday after the company updated earnings estimate for fourth-quarter fiscal 2017, which is below analyst expectation. However, shares of this specialty retailer of women’s intimate and other apparel, beauty and personal care products have increased 14.5% in the past six months, underperforming the industry’s growth of 19.4%.
Coming to numbers, L Brands comps for the five-week period ended Dec 30,, 2017, inched up 1% after witnessing a decline of 1% and an increase of 2% in the month of November and October, respectively. We note that comps have declined 2%, 4%, 7%, 9%, 7%, 5%, 10%, 13% and 4% in September, August, July, June, May, April, March, February and January, respectively. Moreover, net sales for December increased 3% to $2.516 billion.
L Brands’ comps decreased 1% at Victoria’s Secret but increased 4% at Bath & Body Works.
For the 48-week ended Dec 30, 2017, the company’s comps had declined 4%, while sales decreased 1.5% to $11.592 billion. The exit from the swim and apparel categories had 3 percentage points and 5 percentage points adverse impact on overall company and Victoria’s Secret comparable sales, respectively.
Apart from L Brands, Costco Wholesale Corporation (NASDAQ:COST) , Zumiez Inc. (NASDAQ:ZUMZ) and Macy's, Inc. (NYSE:M) came out with their comps results. Comps of both Costco and Zumiez increased 11.5% and 7.9% for December, respectively. Moreover, Macy’s comps, on an owned plus licensed basis, inched up 1.1% during the combined period of November and December; while on an owned basis, comparable sales rose 1%.
Merchandise margins
Victoria’s Secret merchandise margin rate decreased in December primarily due to rise in promotional activities. Moreover, in case of Bath & Body Works merchandise margin rate was down in December compared with last year.
Further, management had earlier stated that it anticipates gross margin to deteriorate year over year during the fourth quarter as well as fiscal 2017.
Outlook
The company expects earnings per share for the fourth quarter to be nearly $2, in comparison with previous guided range of $1.95 to $2.10. The Zacks Consensus Estimate for the fourth quarter is currently pegged at $2.04, which could witness downward revisions in the coming days. L Brands expects comps to increase by low-single digit in January.
L Brands currently carries a Zacks Rank #3 (Hold). You can see the complete list of today’s Zacks #1 Rank (Strong Buy) stocks here.
Zacks Editor-in-Chief Goes ""All In"" on This Stock
Full disclosure, Kevin Matras now has more of his own money in one particular stock than in any other. He believes in its short-term profit potential and also in its prospects to more than double by 2019. Today he reveals and explains his surprising move in a new Special Report.
Zumiez Inc. (ZUMZ): Free Stock Analysis Report
L Brands, Inc. (LB): Free Stock Analysis Report
Costco Wholesale Corporation (COST): Free Stock Analysis Report
Macy's Inc (M): Free Stock Analysis Report
Original post
Zacks Investment Research