The Kroger Co. ( (KR) is a retailer in the United States. The Company also manufactures and processes some of the food for sale in its supermarkets.
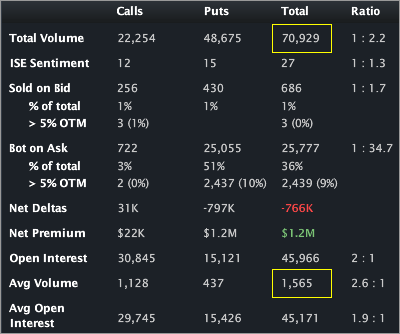
This is an order flow note with earnings due out in two days BMO. The company has traded almost 71,000 contracts on total daily average option volume of just 1,565. The largest trade looks like a purchase of a an Apr 23 / Mar 22 put spread funded by a sale of Mar 25 calls. Each leg was done 19,750x for 59,250 contracts. I believe the trade was done with 840,000 shares (purchases). The Stats Tab and Day's biggest trades snapshots are included (below).

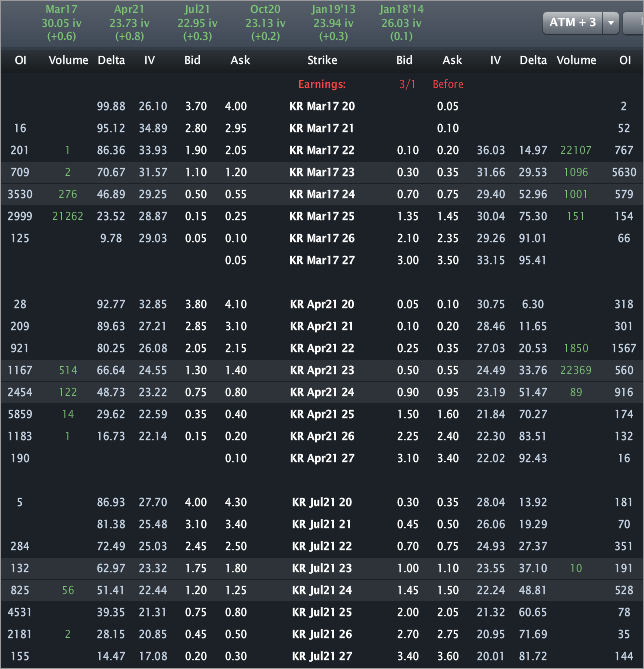
The Options Tab (below) illustrates that all three legs are mostly opening (compare OI to trade size). When looking down the entire option chain for KR, I don't see any OI close to those sizes, so all sides of this trade are very large. One caveat here, 840,000 to 59,250 contracts is just 14 delta The put spread with the short puts is actually more like 45 delta. So it's either not a full hedge (thus a substantially bearish bet), or I'm totally misreading this.
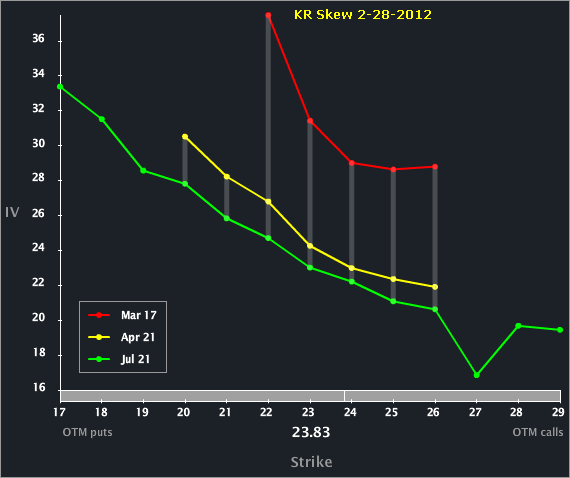
The Skew Tab snap (below) illustrates the vols by strike by month.
We can see the elevated front month vol, which is normal given that earnings are due out very soon. All three of the front expiries show a normal skew skew shape -- not a whole lot "special" here.
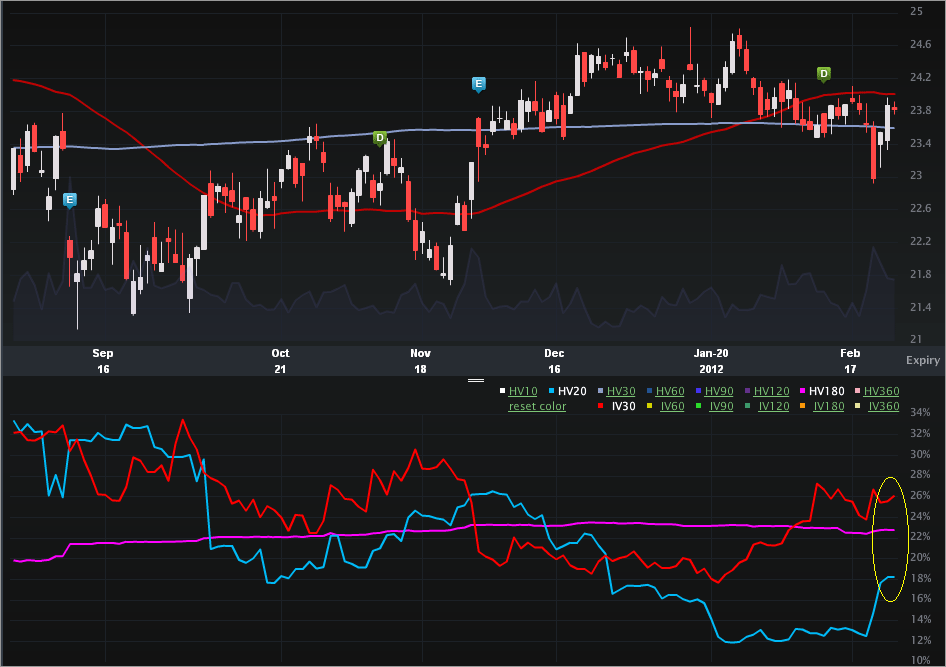
Finally, the Charts Tab (six months) is below. The top portion is the stock price, the bottom is the vol (IV30™ - red vs HV20™ - blue vs HV180™ - pink).
We can see the stock has been pretty steady (note the values on the vertical axis). The HV20™ is 18.21% and the HV60™ is 17.43%. The implied has been rising from 17.70% on 1-23-2012 to now over 26%.
It will be interesting to see how earnings play out -- that's a huge bet given he relative stability of the stock price of late (HV measures). I do note that the puts are owned in April -- not March.
This is trade analysis, not a recommendation.
- English (UK)
- English (India)
- English (Canada)
- English (Australia)
- English (South Africa)
- English (Philippines)
- English (Nigeria)
- Deutsch
- Español (España)
- Español (México)
- Français
- Italiano
- Nederlands
- Português (Portugal)
- Polski
- Português (Brasil)
- Русский
- Türkçe
- العربية
- Ελληνικά
- Svenska
- Suomi
- עברית
- 日本語
- 한국어
- 简体中文
- 繁體中文
- Bahasa Indonesia
- Bahasa Melayu
- ไทย
- Tiếng Việt
- हिंदी
Kroger: Large Bearish Bets Roll in Ahead of Earnings
Published 02/29/2012, 01:51 AM
Updated 07/09/2023, 06:31 AM
Kroger: Large Bearish Bets Roll in Ahead of Earnings
Latest comments
Loading next article…
Install Our App
Risk Disclosure: Trading in financial instruments and/or cryptocurrencies involves high risks including the risk of losing some, or all, of your investment amount, and may not be suitable for all investors. Prices of cryptocurrencies are extremely volatile and may be affected by external factors such as financial, regulatory or political events. Trading on margin increases the financial risks.
Before deciding to trade in financial instrument or cryptocurrencies you should be fully informed of the risks and costs associated with trading the financial markets, carefully consider your investment objectives, level of experience, and risk appetite, and seek professional advice where needed.
Fusion Media would like to remind you that the data contained in this website is not necessarily real-time nor accurate. The data and prices on the website are not necessarily provided by any market or exchange, but may be provided by market makers, and so prices may not be accurate and may differ from the actual price at any given market, meaning prices are indicative and not appropriate for trading purposes. Fusion Media and any provider of the data contained in this website will not accept liability for any loss or damage as a result of your trading, or your reliance on the information contained within this website.
It is prohibited to use, store, reproduce, display, modify, transmit or distribute the data contained in this website without the explicit prior written permission of Fusion Media and/or the data provider. All intellectual property rights are reserved by the providers and/or the exchange providing the data contained in this website.
Fusion Media may be compensated by the advertisers that appear on the website, based on your interaction with the advertisements or advertisers.
© 2007-2025 - Fusion Media Limited. All Rights Reserved.
