Retail department store chain Kohls Corp (NYSE:KSS) stock recently collapsed in reaction to its blowout Q1 2021 earnings results providing prudent investors an opportunity to reload shares. When a stock tanks after a dramatic upside beat, it’s natural to assume the upside was priced into the shares. This “conveniently” explains the sell-the-news reaction afterward. Perhaps, the sell-off was attributed to comparing the Q1 2021 top line falling short of the Q1 2019 revenues, despite the 69.5% revenue growth compared to Q1 2020. It’s a question of what size peg fits in the square hole for the time being.
The market is notorious for overreacting and mistakenly reacting to events. We know that the spread of COVID vaccinations is accelerating the U.S. reopenings as the pandemic shifts into the rearview mirror. While other countries including Canada, India, and Europe are still experiencing COVID-19 lockdowns and capacity restrictions, the U.S. has made great strides in returning back to normal with spring-loaded pent-up demand in the epicenter industries including retail, travel, and leisure. With shares trading under a forward P/E of 14, prudent investors can use the opportunistic pullbacks to considering reloading shares of Kohl’s.
Q1 2020 Earnings Release
On May 20, 2021, Kohl’s released its fiscal first-quarter 2021 results for the quarter ending April 2021. The Company reported an adjusted earnings-per-share (EPS) profit of $1.05 excluding non-recurring items versus consensus analyst estimates for a loss of (-$0.12), beating estimates by $1.17. Revenues grew by 69.6% year-over-year (YOY) to $3.80 billion crushing analyst estimates for $3.35 billion.
The Company reduced long-term debt by $500 million ending the quarter with $1.6 billion in cash. Kohl’s CEO Michelle Gass stated, “We are very pleased with our strong start to 2021 with both sales and earnings materially exceeding expectations. Along with a favorable consumer spending backdrop, we continue to see our key strategic initiatives gain traction and resonate with customers… We are eagerly preparing for the upcoming launch of our Sephora partnership as well as the introduction of several new exciting brands this fall.”
Raised Full-Year 2021 Guidance
Kohl’s raised its full-year 2021 EPS guidance to $3.80 to $4.20 versus $2.82 consensus analyst estimates, up from prior guidance range of $2.45 to $2.95. The Company sees revenue growth of mid to high teens versus 17% YoY growth or $17.56 billion, up from 15% prior guidance.
Conference Call Takeaways
Kohl’s CEO, Michelle Gass, set the tone:
“Sales strengthened as we move through the period with March and April combined sales positive as compared to the same period in 2019. Store sales more than doubled year-over-year due to continued traction against our strategy and lapping last year’s store closures. We experienced an acceleration in customer visits as the quarter progressed, which contributed a majority of our total Q1 sales upside. Our digital business also had a great quarter with sales increasing 14% to last year and up more than 40% to 2019. Digital accounted for 30% of sales with stores continuing to support growth by fulfilling nearly 40% of digital sales.”
The best performing areas were incidentally the one’s that were affected the most during the pandemic, men’s, and women’s apparel. The home business continued to maintain momentum up low double-digits. The Company delivered the highest operating margin in the past eight year at 7%.
Bolstering Active and Casual Lifestyles
CEO Gass underscored the success of the pivot to pushing more active and casual lifestyle products. The active sales have doubled YoY growing to 23% of sales. The Company is targeting the active category to grow north of 30% of sales, which includes its own private label athleisure brand FLX. The FLX brand will broaden its offerings and expand into 500 stores by fall. Capping off the strategy with an emphasis on providing an easier and convenient shopping experience that clearly offers compelling value. She summed it up, “As more people return to work, resume travel and attend events and gatherings, they are seeking out new and updated apparel, while maintaining the preference for casual comfort, which firs squarely into the product categories we are taking a leadership position in. Against this backdrop, Kohl’s is positioned really well.”

KSS Opportunistic Pullback Levels
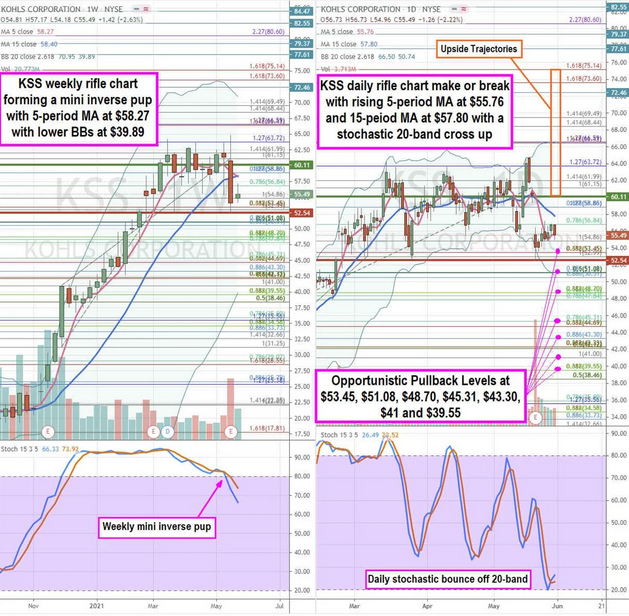
Using the rifle charts on the weekly and daily time frames provides a precision view of the landscape for KSS stock. The weekly rifle chart peaked out around the $63.72 Fibonacci (fib) level. The recent earnings reaction collapsed the stock through the weekly 5-period moving average (MA) now at $58.27 to form a weekly market structure high (MSH) sell trigger on a $52.54 breakdown. The weekly lower Bollinger Bands sit near the $39.55 fib. The weekly stochastic formed a bearish mini inverse pup.
The weekly market structure low (MSL) buy triggers above the $60.11 level. The daily rifle chart is forming a make or break with a rising 5-period MA at $55.76 and 15-period MA at $57.80. The daily upper BBs overlap with the $66.59 super fib. Prudent investors can watch for opportunistic pullback levels at the $53.45 fib, $51.08 fib, $48.70 fib, $45.31 fib, $43.30 fib, $41.00 fib, and the $39.55 fib/weekly lower BBs. Upside trajectories range from the $60.11 MSL trigger up to the $75.14 fib.
