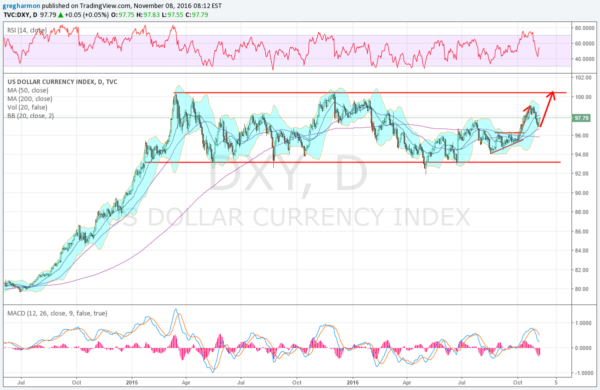
The US Dollar Index started a run higher in July 2014. After peaking just over 100 in March 2015, it settled into a holding pattern 8 months later. Since then it has bounced between 93 and 100 for nearly 20 months. I have noted that the dollar tends to move in 7-year cycles. 8 months was hardly a 7-year cycle. So is it just taking a breather waiting for the action to start in January?
If not January what, then, might the dollar be waiting for? Many signs point to today's election. Fed watchers are keen to point out that the FOMC was bound to wait until after the election to raise rates. The rhetoric from Fed speakers seems to point to a hike at the December meeting --well after the election. And the charts tell a similar story.
The chart above shows the USD during this time period. The back-and-forth motion has worked out to a move higher that started in October. That peaked at the end of the month and led to the recent pullback. It found support when it hit the lower Bollinger Band® and turned sharply higher Monday. Now on election day, it is continuing.
Target To Watch
A measured move gives a target to the top of the channel at 100.40. With symmetry that would happen at the end of November. Then a push higher into December and into 2017? We will have to wait and see for that. For now it looks like the top of the channel is in the eyesight.

