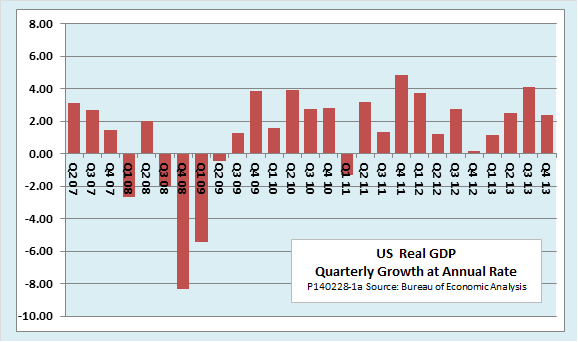
Revised data released Friday by the Bureau of Labor Statistics showed that U.S. real GDP grew at an annual rate of 2.4 percent in the fourth quarter of 2014, somewhat slower than the 3.2 percent previously reported. Allowing for population growth of about 0.7 percent, the annualized growth rate of real GDP per capita was 1.7 percent. The report also showed that key inflation measures derived from the national income accounts slowed in the quarter.

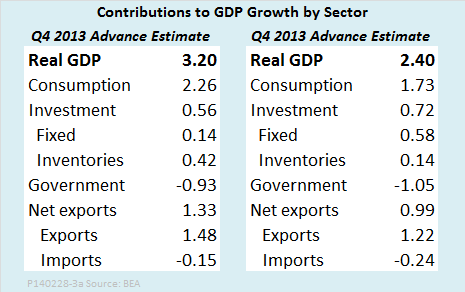
As the following table shows, the downward revisions affected nearly all sectors of the economy. The one bright spot was the contribution to GDP growth from private investment, which increased from a previously estimated .58 percentage points to .72 percentage points. Furthermore, more of the growth came from fixed investment and less from inventory buildup than previously reported. The contributions from consumption and net exports were both less than previously reported.

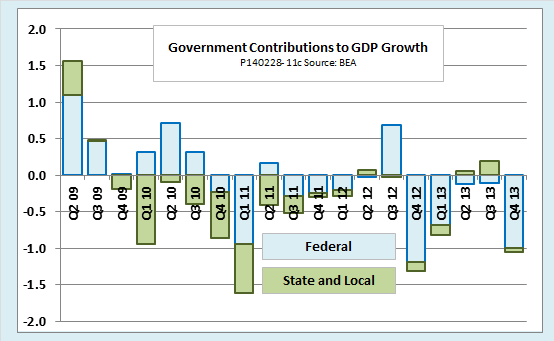
The government contribution to GDP growth, as measured by government consumption expenditures and gross investment, was an unusually large negative, -1.05 percentage points. Most of that was due to falling federal spending, especially on defense, but the state and local government contribution to growth turned negative for the first time since last winter. As the next chart shows, shrinking government consumption and investment expenditure has been a drag on the recovery for most of the past four years.

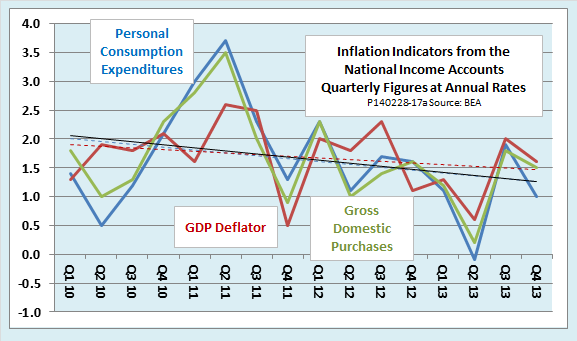
The national income accounts also provide several measures of inflation. The following chart shows three of them. The broadest is the GDP deflator, which shows changes in the prices of all final goods and services produced by the economy. The deflator for gross domestic purchases is based on the prices of goods bought by consumers, business, and government within the United States. The deflator for personal consumption expenditures measures the prices of goods and services bought by households. The PCE deflator is important because it is the basis for the Fed’s key inflation target, set at 2 percent per year. As the chart shows, all three measures of inflation have been running below target .

On the whole, the latest revisions confirm what we already knew: The U.S. economy continues slowly to recovery. Federal budget austerity continues to be one of the factors restraining the rate of growth. And an upside breakout of inflation continues to be among the smallest of risks facing the economy.
