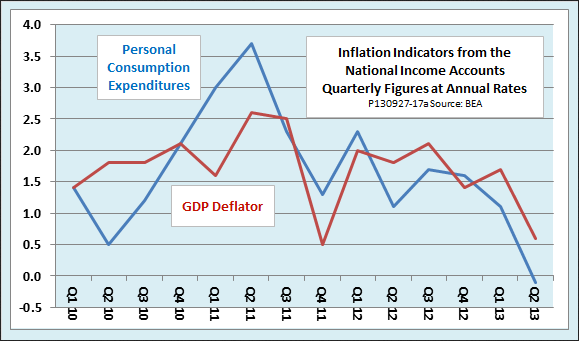
There was an interesting nugget of data buried deep in Thursday’s GDP report from the Bureau of Economic Analysis: The rate of change of the deflator for personal consumption expenditures fell to an annual rate of -0.1 percent from the 0.0 percent rate reported earlier. An even broader measure of inflation, the GDP deflator, was also revised downward, although it remained positive. The PCE deflator, rather than the more widely publicized Consumer Price Index, is the Fed’s preferred indicator of price trends.
Time To Panic?
The downturn in the PCE deflator prompted University of Michigan professor Justin Wolfers to ask, in a blog post on Bloomberg.com, Where is the Panic over Deflation?. To be fair, Wolfers was quick to say that he himself was not panicking at a one-quarter downturn in a single inflation indicator. Still, it is a good question. Is this the time to begin worrying about deflation, or isn't it?
It's not.
Look Forward
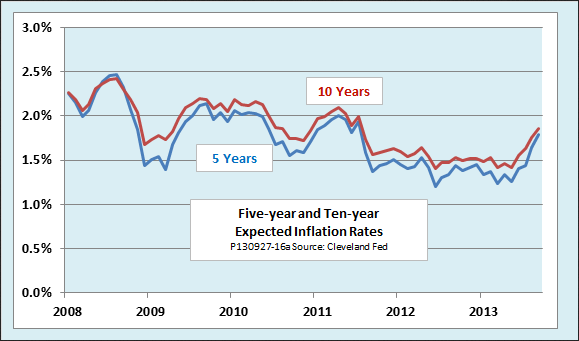
Before reading too much into the downtick in the PCE deflator for the second quarter, we should check some forward-looking inflation indicators. One of the best is the inflation expectations measure published by the Cleveland Fed. It draws on price trends for Treasury Inflation Protected Securities (TIPS), bonds that carry inflation protection linked to the CPI. The spread between the TIPS price and the price of ordinary Treasury bonds of similar maturity indicates how much investors are willing to pay for inflation protection. The Cleveland Fed decomposes that spread into a measure of inflation expectations and a risk premium. As the next chart shows, after reaching record lows earlier this year, both the Cleveland Fed’s 5-year and 10-year expected inflation rates have moved up. Clearly, the upturn points to a reduced probability of deflation.
The Fed's Take
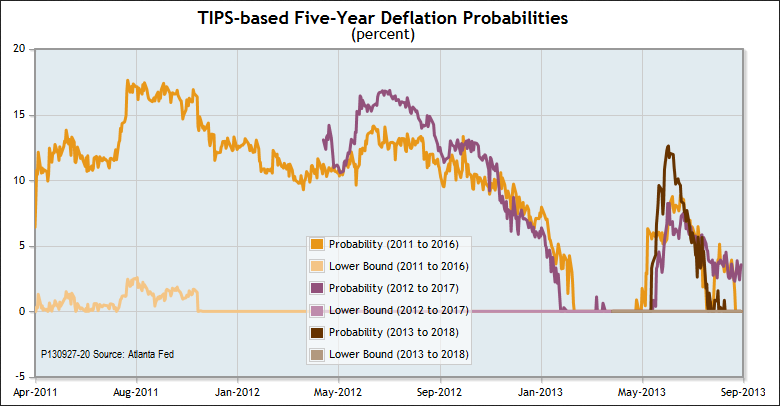
Meanwhile, the Atlanta Fed cleverly massages the TIPS data in a different way to estimate the probability of deflation directly. The Atlanta Fed’s indexes of deflation probability make use of the fact that TIPS of overlapping maturities provide slightly different degrees of protection against deflation risk. As the next chart shows, for most of 2011 and 2012, the probability of deflation held in the 10 to 15 percent range. In late 2012, it fell below 10 percent and by early this year, it hit zero. After a brief mid-year spike, perhaps caused by confusion over the Fed’s tapering intentions, it is now back to zero.
So don’t panic about deflation. It’s not in the cards. That does not mean all is well, of course. It would be nice if we could be more certain that the Fed will actually be able to achieve its 2 percent inflation target. Doing so might plausibly help pull the U.S. economy out of the doldrums. Unfortunately, there is a definite risk that the Fed will start tightening well before either actual inflation or inflation expectations reach the target rate.
Which stock should you buy in your very next trade?
AI computing powers are changing the stock market. Investing.com's ProPicks AI includes 6 winning stock portfolios chosen by our advanced AI. In 2024 alone, ProPicks AI identified 2 stocks that surged over 150%, 4 additional stocks that leaped over 30%, and 3 more that climbed over 25%. Which stock will be the next to soar?
Unlock ProPicks AI
