
Kellogg Company (NYSE:K) posted better-than-expected results in the second quarter of 2017 on cost savings and a tax benefit. However, sales suffered owing to industry-wide soft consumption trends for packaged food items.
Earnings Beat
Second-quarter comparable earnings of 97 cents per share beat the Zacks Consensus Estimate of 92 cents by 5.4%. Earnings increased 6.6% year over year banking on higher operating profit and a lower effective tax rate, which more than offset a higher level of restructuring charges.
Excluding currency headwinds of 1 cent, earnings increased 7.7% year over year.
Adjusted earnings exclude costs associated with Project K, a mark-to-market loss and certain other items. Including these items, however, the company reported earnings of 80 cents per share, higher than year-ago earnings of 79 cents.
Revenues Beat
Kellogg reported revenues of $3.19 billion, down 2.5% year over year, marking the 10th straight quarter of revenue decline. The decline can be primarily attributed to weak consumer demand across most parts of the North American regions and Europe. Revenues fell shy of the Zacks Consensus Estimate of $3.15 billion by 1.3%.
Currency hurt sales by 0.7% in the quarter. Acquisitions had a 1.5% positive impact on revenues. However, Venezuela deconsolidation had a 0.2% negative impact on the top line. Accordingly, organic revenues (excluding the impact of acquisitions, dispositions and foreign exchange) fell 3.1% compared with a 4.4% decline in the previous quarter. Except Asia Pacific, organic sales decreased across all other regions.
Volumes decreased 4.9%, a shade better than the 5.7% decrease in the preceding quarter. On the other hand, price/mix added 1.8% to sales, higher than the 1.3% contribution last quarter.
Profits Rise
Kellogg’s operating margin (currency-neutral comparable growth) was 17.2%.
Comparable operating profit grew 5.9% to $538 million.
However, excluding the currency impact of 1%, adjusted (currency-neutral comparable) operating profit increased approximately 6.9% to $544 million on strong Project K and Zero-Based Budgeting cost savings.
Segment Discussion
Total North America: Kellogg’s North America sales declined 2.6% (down 2.4% organically) year over year to $2.15 billion, due to a shift in the consumer preference to healthier options from its processed food offerings. Volumes decreased 3.7% compared with 4.9% growth witnessed in the previous quarter. Price/mix increased 1.8% compared with a 0.5% growth in the prior quarter. Adjusted (currency-neutral comparable) operating profit increased 6.8% in North America.
Europe: Segment revenues of $566 million declined 10% due to currency headwinds of 3.6%. Organically, sales were down 7% in the second quarter compared with a decline of 8.3% in the last quarter. Adjusted operating profit declined 1.1%.
Latin America: Segment revenues of $234 million improved 14.8% (organically, revenues were down 4%) owing to 3.4% price/mix growth. This was partly offset by a 7.4% decline in volume and 0.9% currency headwind. Adjusted operating profit decreased 14.6% in Latin America.
Asia Pacific: Segment revenues of $238 million improved 4.3% on the back of strong growth across the region for Pringles. Organically, sales increased 2.1%, softer than 2.9% growth in the last quarter. Adjusted operating profit improved 34.9% in the Asia Pacific. Volumes were down 1.9%, while price/mix grew 4%, in the quarter.
2017 Views Reaffirmed
The company expects revenues to decline about 3% on a currency-neutral comparable basis.
The company expects adjusted constant currency earnings to grow 8–10% in the range of $4.03–$4.09 per share.
However, including currency impact of 6 cents after tax, adjusted EPS is now expected in the range of $3.97–$4.03 against $3.91–$3.97 expected earlier.
Adjusted constant currency operating profit growth projection was maintained in the range of 7–9%. Operating margin is expected to improve more than a full percentage point, and is well on track to achieve its goal of 350 basis points expansion from 2015 through 2018.
Zacks Rank
Kellogg carries a Zacks Rank #2 (Buy). You can see the complete list of today’s Zacks #1 Rank (Strong Buy) stocks here.
Peer Releases
Dr Pepper Snapple Group Inc. (NYSE:DPS) reported second-quarter 2017 adjusted earnings per share of $1.25 missing the Zacks Consensus Estimate of $1.28 by 2.3%. Earnings were flat on a year-over-year basis.
The Hershey Company’s (NYSE:HSY) second-quarter adjusted earnings per share of $1.09 beat the Zacks Consensus Estimate of 91 cents by 19.8%. Earnings also increased from the year-ago profit level of 85 cents by 28.2%.
The Procter & Gamble Company (NYSE:PG) , popularly known as P&G, reported fourth-quarter fiscal 2017 core earnings of 85 cents per share beating the Zacks Consensus Estimate of 78 cents by 9%. The bottom line also increased 8% from the prior-year quarter.
Kellogg Company Price, Consensus and EPS Surprise
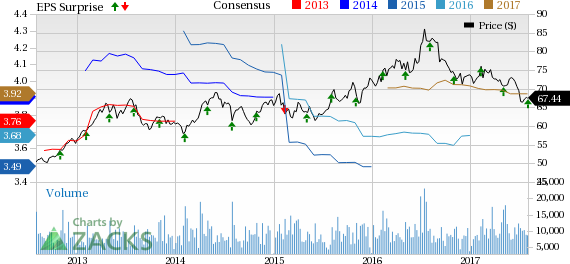
Kellogg Company Price, Consensus and EPS Surprise | Kellogg Company Quote
More Stock News: Tech Opportunity Worth $386 Billion in 2017
From driverless cars to artificial intelligence, we've seen an unsurpassed growth of high-tech products in recent months. Yesterday's science-fiction is becoming today's reality. Despite all the innovation, there is a single component no tech company can survive without. Demand for this critical device will reach $387 billion this year alone, and it's likely to grow even faster in the future.
Zacks has released a brand-new Special Report to help you take advantage of this exciting investment opportunity. Most importantly, it reveals 4 stocks with massive profit potential. See these stocks now>>
Dr Pepper Snapple Group, Inc (DPS): Free Stock Analysis Report
Hershey Company (The) (HSY): Free Stock Analysis Report
Kellogg Company (K): Free Stock Analysis Report
Procter & Gamble Company (The) (PG): Free Stock Analysis Report
Original post
Zacks Investment Research