KB Home (KBH) is a homebuilding company. The Company constructs and sells homes through its operating divisions under the name KB Home.
This is another vol note, but more holistic than the strike-by-strike view. There's an interesting phenomenon that can occur as vol dips in an abruptly rising stock. We can find depressed vol relative to the historical measures as the market reflects "lower risk" in an up trending stock. But, if you own gamma and the stock moves up more than the implied priced, well, you get the point... Down isn't the only direction that wins when owning gamma.
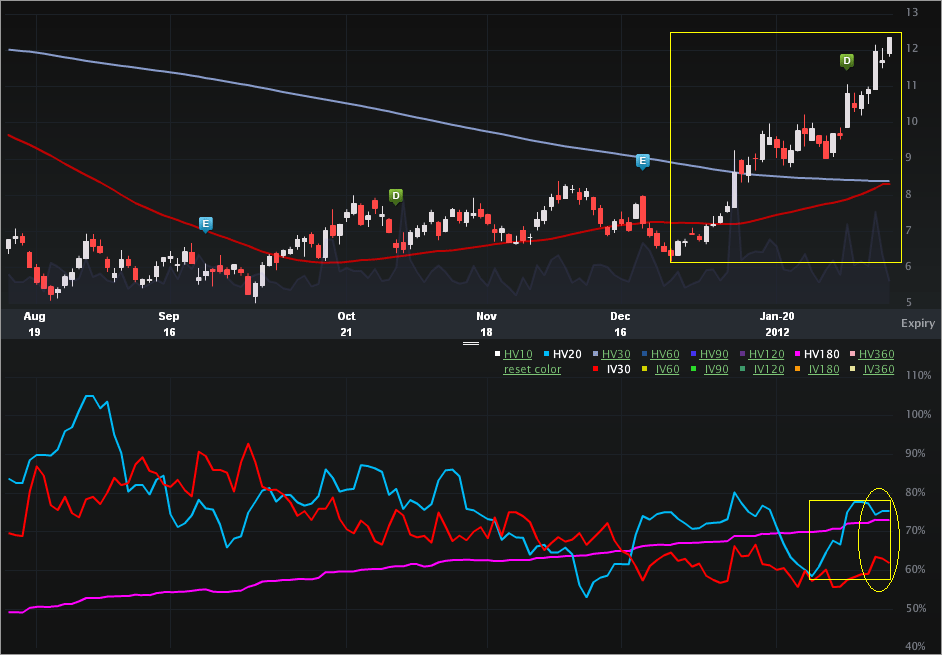
The Charts Tab (six months) for KBH is below. The top portion is the stock price, the bottom is the vol (IV30™ - red vs HV20™ - blue vs HV180™ - pink).
First, let's look to the stock portion on the top. I've highlighted the recent big move up. How big?... On 12-28-2011 the stock closed at $6.34. That's a 94.8% rise in about six weeks. On the vol side, check out how the HV20™ has been rising of late as the stock price has been moving up. But, as the actual realized volatility of the underlying has been rising, the implied has risen less. With the implied already trading below the historical measures before that gap has now opened up further. In English, the option market reflects lower risk as the realized vol has risen. Lest we forget, upward stock movement is volatility too. The vol comps are included below:
IV30™: 61.89%
HV20™: 75.44%
HV180™: 73.21%
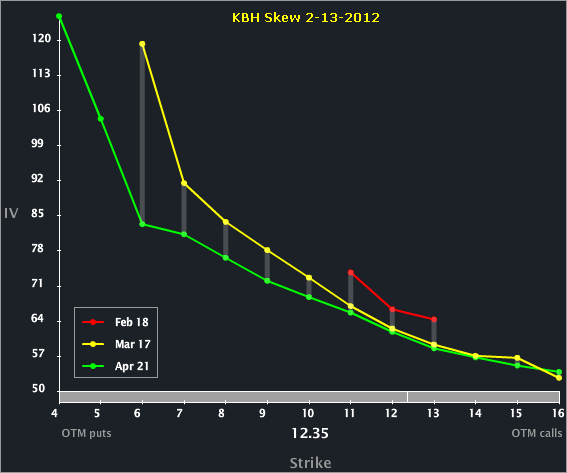
Let's turn to the Skew Tab.
We can see similar shapes for all three of the front expiries and the front is elevated to the back monotonically for the all three.
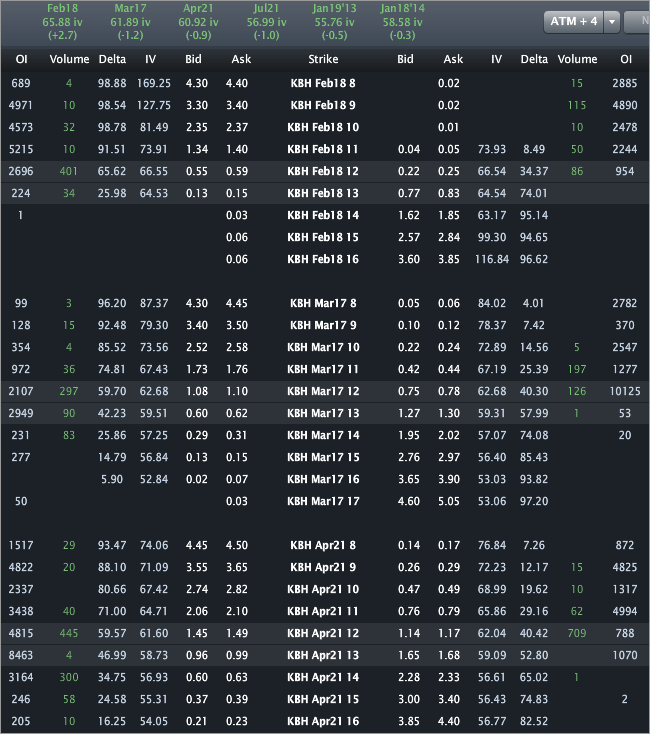
Finally, let's turn to the options tab, for completeness.
The months are priced to 65.88%, 61.89% and 60.92%, respectively for Feb, Mar and Apr. The next earnings release is projected somewhere near the middle of Mar -- which straddles two expiries. Depressed vol in a rising stock and an earnings event is in interesting proposition.
This is trade analysis, not a recommendation.
- English (UK)
- English (India)
- English (Canada)
- English (Australia)
- English (South Africa)
- English (Philippines)
- English (Nigeria)
- Deutsch
- Español (España)
- Español (México)
- Français
- Italiano
- Nederlands
- Português (Portugal)
- Polski
- Português (Brasil)
- Русский
- Türkçe
- العربية
- Ελληνικά
- Svenska
- Suomi
- עברית
- 日本語
- 한국어
- 简体中文
- 繁體中文
- Bahasa Indonesia
- Bahasa Melayu
- ไทย
- Tiếng Việt
- हिंदी
KB Home: Vol Drops as Stock Explodes; Isn't Upside Risk Too?
Published 02/14/2012, 12:22 AM
Updated 07/09/2023, 06:31 AM
KB Home: Vol Drops as Stock Explodes; Isn't Upside Risk Too?
Latest comments
Loading next article…
Install Our App
Risk Disclosure: Trading in financial instruments and/or cryptocurrencies involves high risks including the risk of losing some, or all, of your investment amount, and may not be suitable for all investors. Prices of cryptocurrencies are extremely volatile and may be affected by external factors such as financial, regulatory or political events. Trading on margin increases the financial risks.
Before deciding to trade in financial instrument or cryptocurrencies you should be fully informed of the risks and costs associated with trading the financial markets, carefully consider your investment objectives, level of experience, and risk appetite, and seek professional advice where needed.
Fusion Media would like to remind you that the data contained in this website is not necessarily real-time nor accurate. The data and prices on the website are not necessarily provided by any market or exchange, but may be provided by market makers, and so prices may not be accurate and may differ from the actual price at any given market, meaning prices are indicative and not appropriate for trading purposes. Fusion Media and any provider of the data contained in this website will not accept liability for any loss or damage as a result of your trading, or your reliance on the information contained within this website.
It is prohibited to use, store, reproduce, display, modify, transmit or distribute the data contained in this website without the explicit prior written permission of Fusion Media and/or the data provider. All intellectual property rights are reserved by the providers and/or the exchange providing the data contained in this website.
Fusion Media may be compensated by the advertisers that appear on the website, based on your interaction with the advertisements or advertisers.
© 2007-2025 - Fusion Media Limited. All Rights Reserved.
