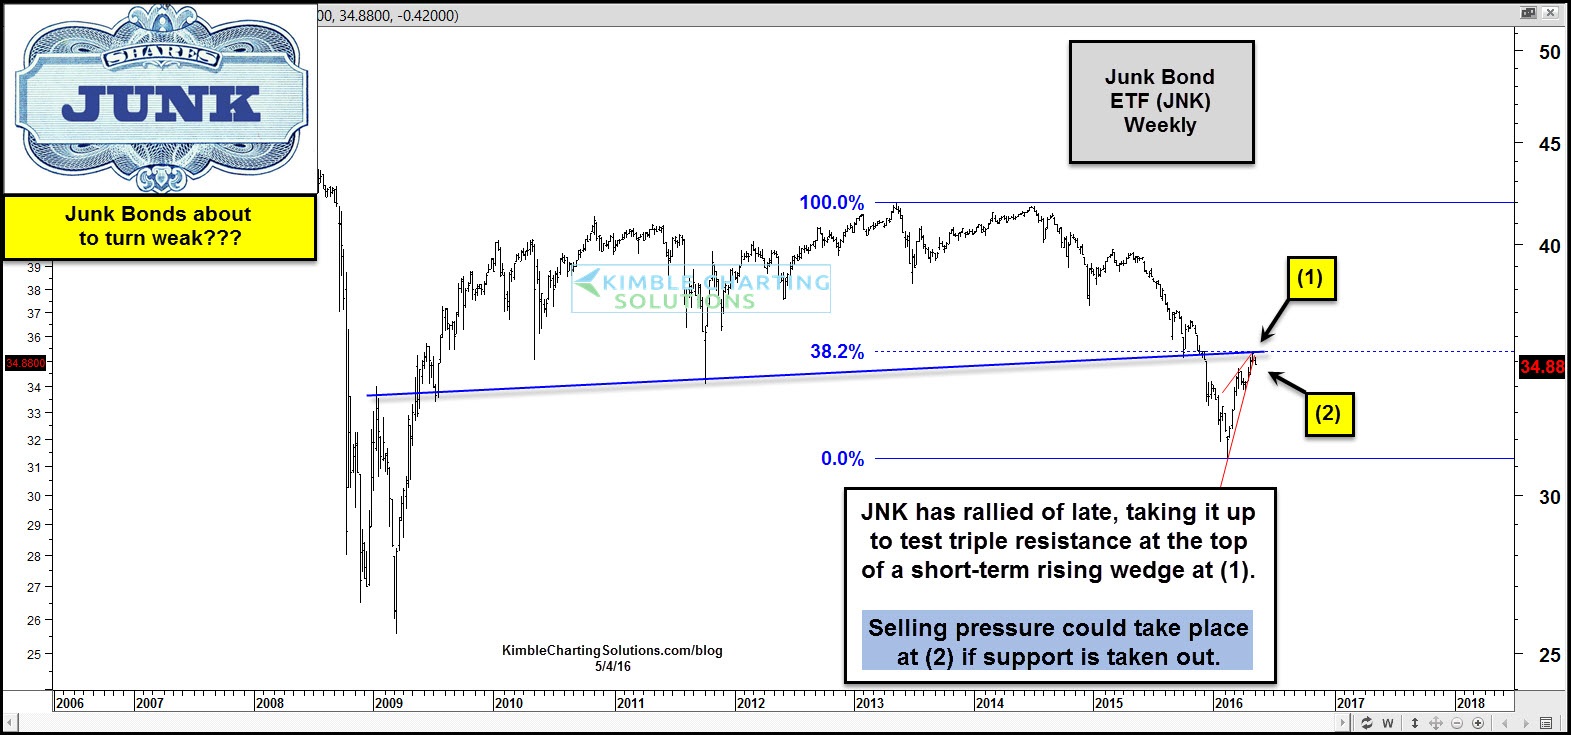
Many traders like to watch junk-bond price action, which can send important messages about the strength -- or lack thereof -- in the stock market. Take a look at Junk Bond ETF (NYSE:JNK)
As you can see, junk bonds appear to have created a double top in 2013 and 2014 as weakness in the sector soon followed. Once weakness really started to take place in the sector (2015), stocks didn’t have much luck moving higher.
JNK created a bullish reversal pattern (bullish wick pattern) the week of 2/5 and started turning higher. As JNK started moving higher, so too did the broad markets.
Now JNK is testing a triple resistance zone at (1) above, with one of the resistance lines being the 38% retracement level of the 2013 highs and 2016 lows. Now JNK is near the apex of a short-term bearish rising wedge at (2) above.
Stock-market investors may want to keep a close eye on junk bonds over the next few weeks to see how they handle this resistance test.
If weakness returns to this sector, it could suggest that stocks may see subdued returns for a while.

