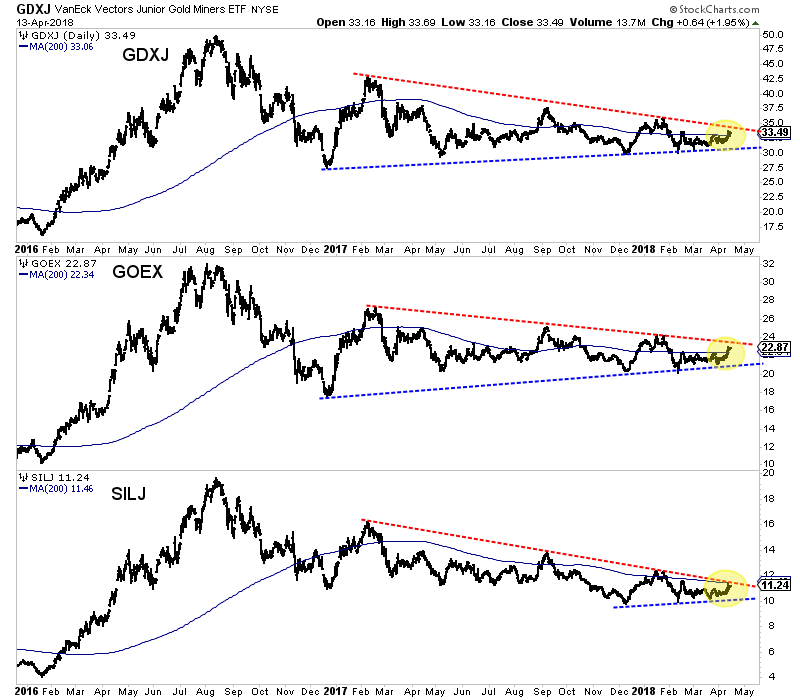
A few weeks ago we wrote that it may not be gold’s time yet but a number of recent developments suggest its time could be sooner than we anticipated. Although gold failed to break out last week, we should note the positive action in the miners. Over the past seven trading days the miners have strongly outperformed gold. That includes the juniors, which appear very close to breaking out of the downtrend that has been in effect for over 12 months.
In the chart below we plot the three major junior ETFs: VanEck Vectors Junior Gold Miners (NYSE:GDXJ), Global X Gold Explorers (NYSE:GOEX) and PureFunds ISE Junior Silver (NYSE:SILJ). The juniors have trended lower since February 2017 but are now threatening to break trendline resistance.
Since December 2017 the juniors have traded in an increasingly tighter and tighter range which indicates a break is coming very soon. Also, note how the 200-day moving averages are flat and no longer sloping lower. That reflects a mature correction and the potential for a new uptrend if the juniors break above resistance in a strong fashion.

There are a few other things worth mentioning.
First, as we alluded to, GDXJ has strongly outperformed gold over the past seven trading days. The GDXJ-to-gold ratio has reached its highest mark since the start of February. That sudden relative strength is significant considering gold is within spitting distance of a major breakout.
Second, one custom breadth indicator we track is the percentage of juniors (a basket of 50 stocks) trading above the 200-day moving average. This figure (currently 42%) has not exceeded 51% since February 2017. A strong push above 51% could confirm a renewed uptrend in the juniors.
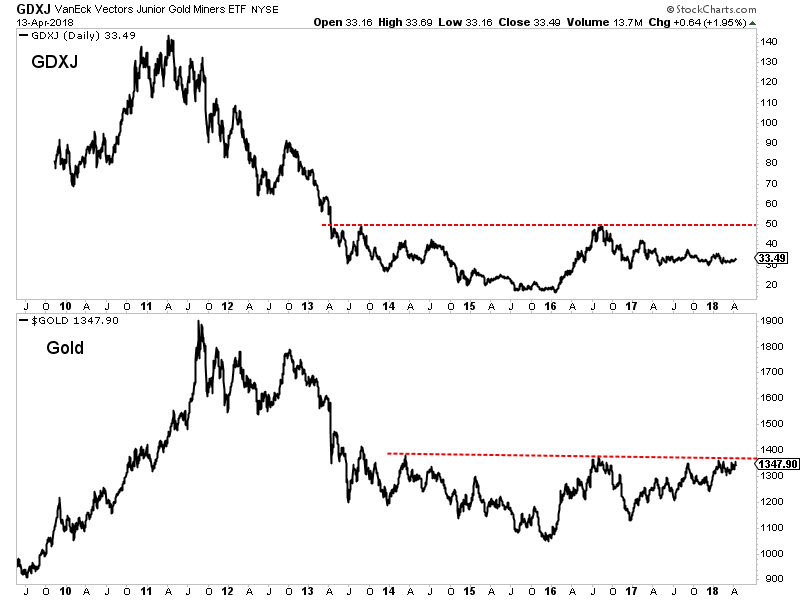
If juniors are going to break out of their downtrends, it could mark the start of potentially a very large move. Gold, upon a breakout through $1375, will have a measured upside target of roughly $1700/oz. Although the juniors aren’t very close to breaking their 2016 high, they, upon a breakout, would have similar upside potential. GDXJ, upon a breakout through $50 would have a measured upside target of $83.

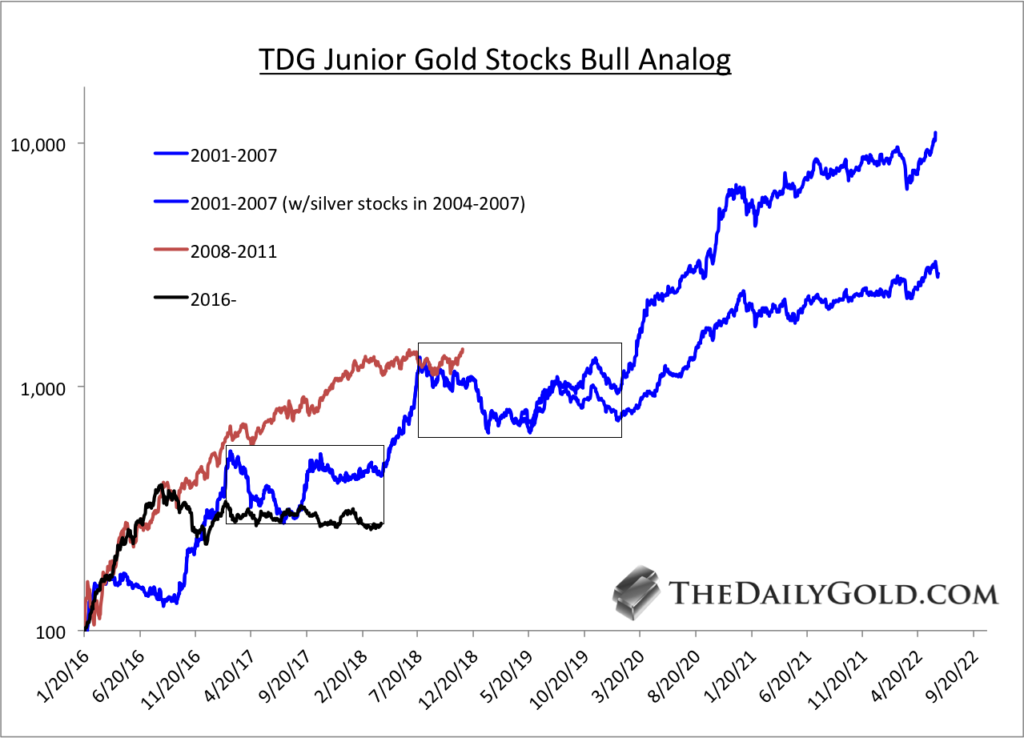
That potential measured upside target for GDXJ may seem extreme but for juniors its par for the course. Below we show an updated chart of our Junior Gold Stocks Bull Analog. By my data, juniors are well below where they were during the 2001-2007 and 2008-2011 bull markets. So if gold breaks higher and is going to reach $1700/oz then juniors are likely to catch up to historical performance.

Although gold failed to break out (again) last week, the performance in the gold stocks did not confirm that failure. The newfound relative strength, if sustained over the next few weeks, could signal that a sector breakout is much closer than previously anticipated.
The juniors are very close to breaking their downtrend and that break could only be the start of a potentially massive move. In anticipation of that potential move, we have been accumulating the juniors that have 300% to 500% upside potential over the next 18-24 months.
