Our recent research suggests the US stock market may be entering a period of volatility that may include a broad market rotation/reversion event. We believe this volatility event could begin to happen anytime over the next 10 to 30+ days. The rally in the US stock market ending 2019 and carrying into 2020 appears to be setting up a “rally to a peak” type of price pattern.
The potential for a volatility spike resulting from a price peak formation (see the January 20, 2020 article above), could setup a moderately broad downside price reversion event that may prompt a 5% to 8%+ downside price correction. If that happens, as we expect, over the next 5 to 10+ trading days, then precious metals and miners should explode to the upside as a “risk-on” trade moves capital into the metals market.
We believe the Miners (both gold and silver) are setting up for an explosive upside price move over the next 60+ days. The reality of the global markets is that it appears to be set up in a very similar manner to what happened in the late 1990s. The rally in Rhodium, Palladium and Platinum are similar to the rally that took place in the late 1990s – just before the real explosion in Gold and Silver began in 2003-04. The rally in Gold and Silver took place after a collapse event in 2000-2001 and set up a massive upside price event for Precious Metals and Miners.
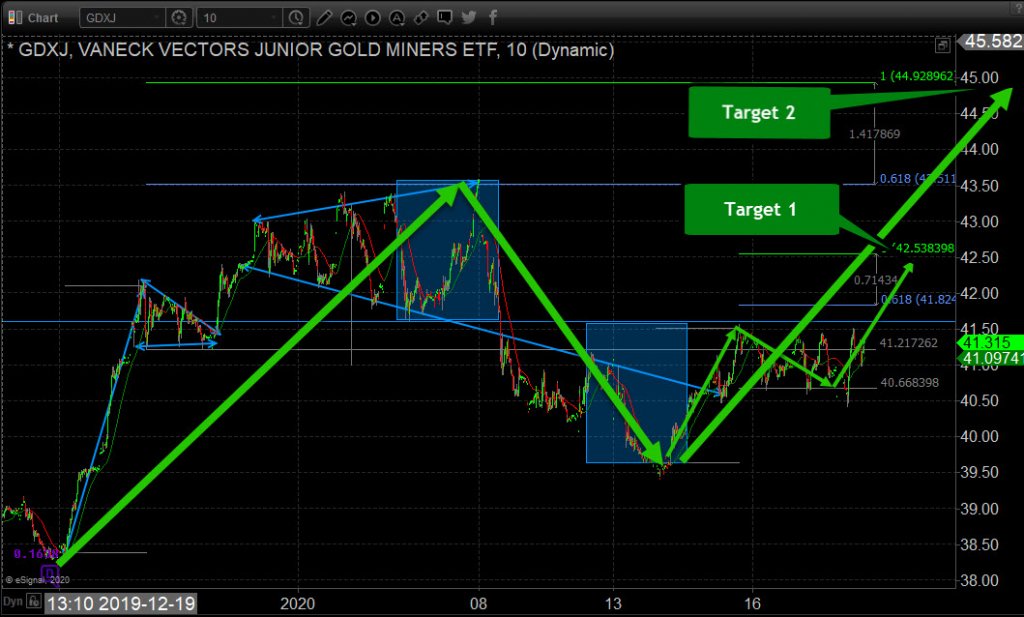
GDXJ 10 Minute Chart (1 Month Data View)
If we start with the shortest time frame analysis of the gold miners you can see a lot of measured moves based on technical analysis that has taken place in the last month of trading and it’s not far from over based on this chart.

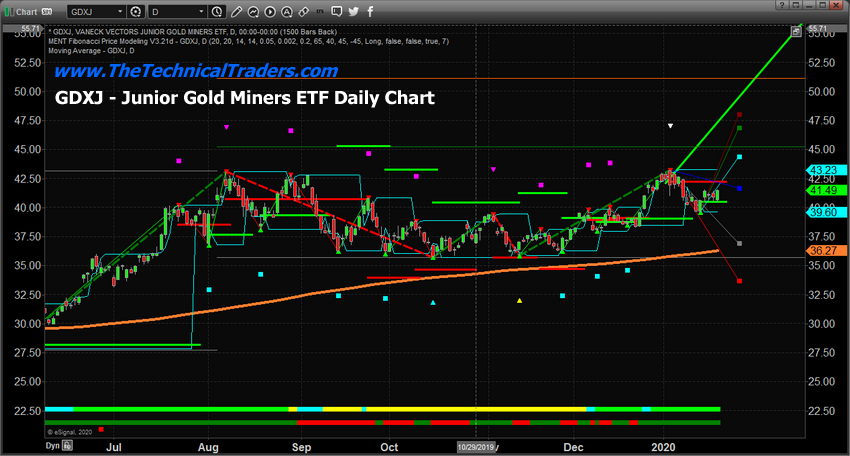
Daily GDXJ Chart
The setup in GDXJ is that Junior Gold Miners should move 15% to 25% higher over the next 30+ days on a price reversion event in the US stock market. We believe the upside target for GDXJ is $46 to $51 from the current levels near $41.50. After a brief pause near $50, GDXJ should attempt another rally to levels above $65 to $70 sometime near June~August 2020.

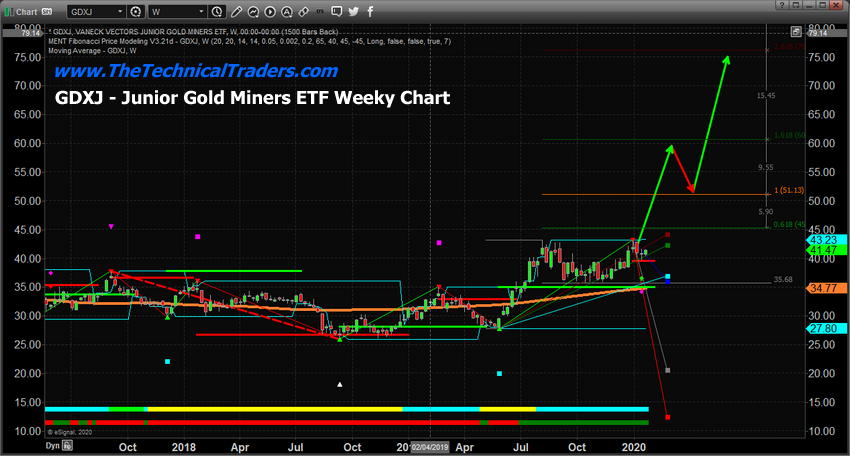
Weekly GDXJ Chart
This Weekly GDXJ chart highlights what we believe will happen over the next 6+ months. The opportunity for skilled traders at this level is incredible. Support near $35.50 has recently been retested and held. Any entry below the $40 level is an incredible opportunity to catch this upside price move.

Concluding Thoughts:
We believe the US stock market will enter a period of volatility over the next 30~60+ days and that volatility will push metals and miners higher into this next wave of advancement. Be prepared for Silver and Silver Miners to rally more than Gold/Gold Miners (potentially). We’ve highlighted how Silver tends to rally a few months behind Gold when a Risk-On trade sets up.
As a technical analysis and trader since 1997 I have been through a few bull/bear market cycles, I have a good pulse on the market and timing key turning points for both short-term swing trading and long-term investment capital. The opportunities are massive/life-changing if handled properly.
2020 is going to be full of incredible trading opportunities for skilled traders. We’ve already set up a number of active trading triggers for our members to profit from the early moves in 2020. This Gold Miners trade is an incredible opportunity for anyone skilled enough to take advantage of it.
