U.S. consumer spending rose 0.1 percent in June. What does it mean for the gold market?
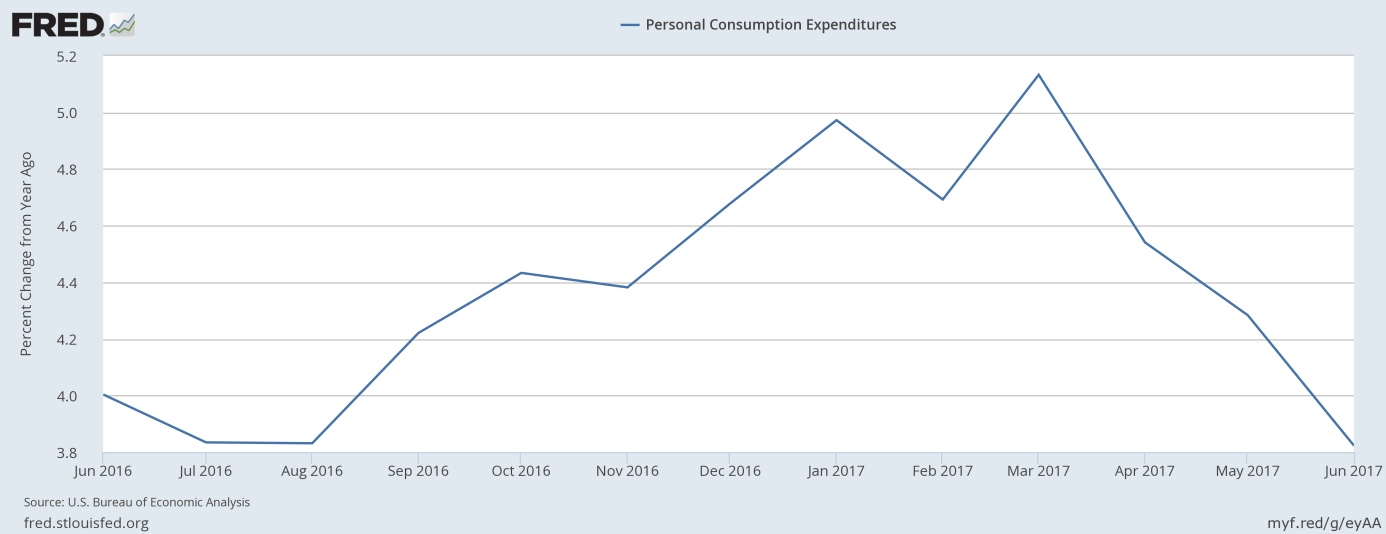
Personal consumption expenditures increased 0.1 percent in June, following a 0.2 percent rise in May (after an upward revision). The rise is soft – U.S. consumer spending increased by the smallest amount in five months – but in line with expectations. On an annual basis, consumer spending rose 3.8 percent, which means that the pace of personal consumption expenditures growth decreased further, continuing its downward trend since March 2017, as one can see in the chart below.
Chart 1: Personal consumption expenditures from 2012 to 2017 (as percent change from year ago).

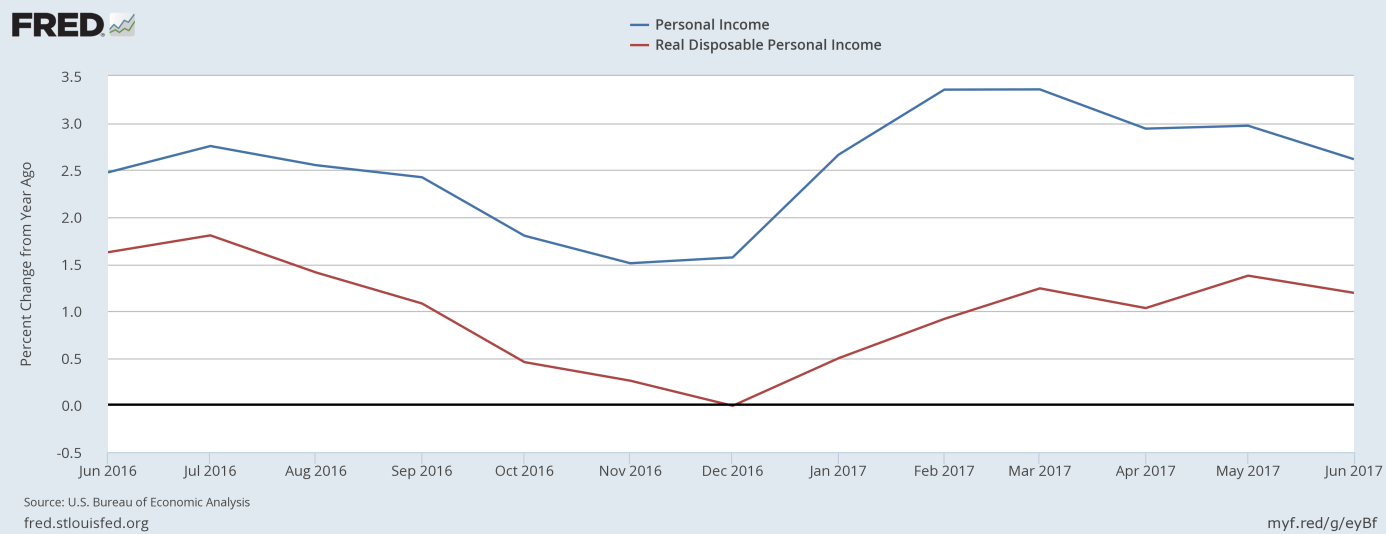
The weak number partially reflected low energy prices and partially the flat incomes. Indeed, personal incomes were unchanged in June, following a 0.3 percent increase in the previous month. The stagnant incomes were a significant negative surprise for analysts. Moreover, nominal personal incomes and real disposable incomes slowed down on an annual basis, as the chart below shows.
Chart 2: Nominal personal income (red line) and real disposable personal income (blue line) over the last 5 years (as percent change from year ago).

However, the wages and salaries rose 0.4 percent in June, which neutralizes the weakness. The flat headline resulted mainly from the 3.0 percent decline in personal dividend income and 1.0 percent decrease in personal interest income.
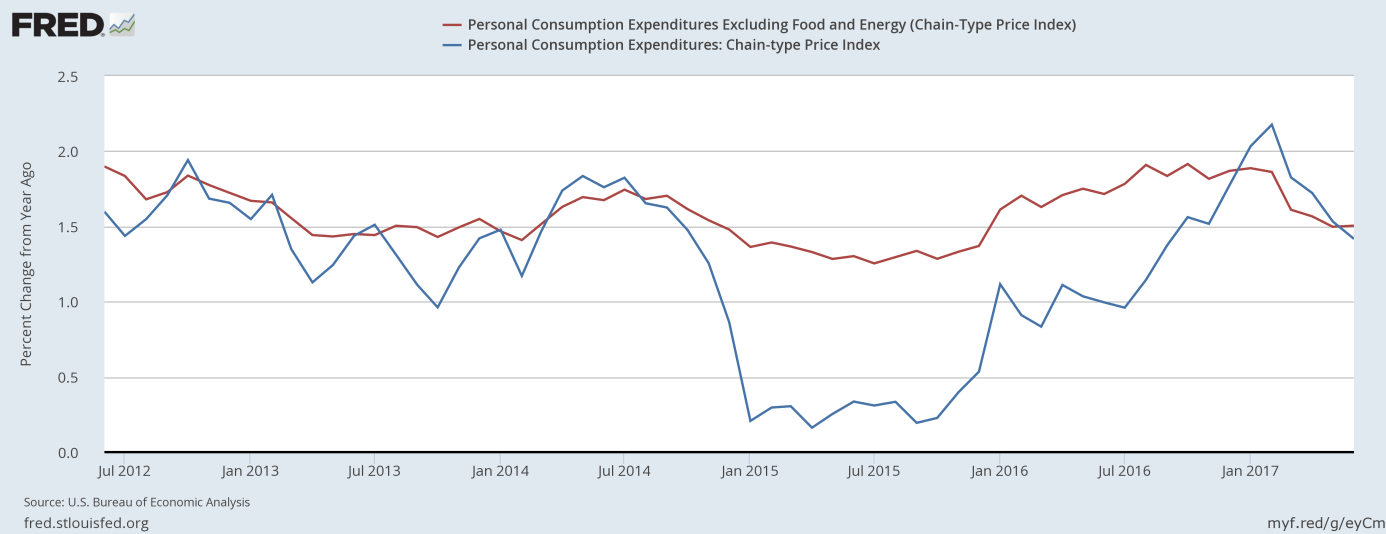
When it comes to inflation, the PCE price index was unchanged for the second month in a row, while its core version increased 0.1 percent in June, the same as in the previous month. On an annual basis, the PCE price index rose 1.4 percent, while its core version jumped 1.5 percent. It means that inflation retreated even further from its five-year peak hit in February, as one can see in the chart below.
Chart 3: PCE Price Index (blue line) and Core PCE Price Index (red line) from 2012 to 2017 (as percent change from year ago).

However, both annual numbers were better than expected. Core inflation stabilized, so overall inflation may also stabilize in the near future. Nevertheless, soft inflation could reinforce concerns among the FOMC members about the appropriate pace of monetary tightening.
The take-home message is that the June personal income and outlays were rather disappointing, as American consumers hardly increased spending for the second month in a row, while inflation weakened further. And, contrary to the previous month, the income side was not solid – actually, it was the weakest part of the report. Hence, the report does not point to much economic momentum going into the third quarter.
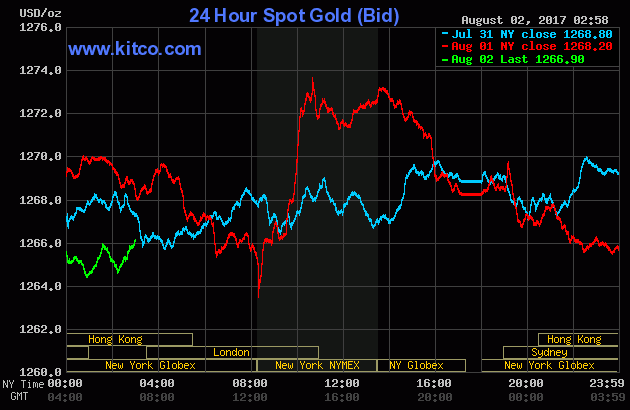
This is, of course, good news for the gold market, as this tepid economic data eroded further the odds of another Fed interest rate hike this year. Indeed, the price of gold jumped almost $10 after the release of the report (however, the move was temporary), as the chart below shows.
Chart 4: Gold price over the three last days.

Disclaimer: Please note that the aim of the above analysis is to discuss the likely long-term impact of the featured phenomenon on the price of gold and this analysis does not indicate (nor does it aim to do so) whether gold is likely to move higher or lower in the short- or medium term. In order to determine the latter, many additional factors need to be considered (i.e. sentiment, chart patterns, cycles, indicators, ratios, self-similar patterns and more) and we are taking them into account (and discussing the short- and medium-term outlook) in our trading alerts.
