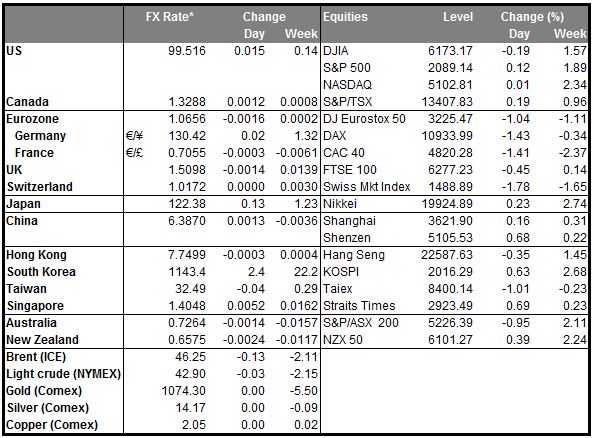
• June 23rd: The date of Britain’s fate UK Prime Minister Cameron struck a deal with his European counterparts on Friday to alter the terms of the UK’s membership in the EU. The agreement includes changes to migrant welfare payments, safeguards for Britain’s financial services from unwanted Eurozone regulations, and greater authority to block EU legislation. Now the battle turns to home. At Saturday’s cabinet meeting the UK Prime Minister Cameron won the support to recommend voters that Britain stays in Europe and immediately after the two-hour gathering he called an in/out referendum to be held on the 23rd of June. However, London Mayor Johnson declared during the weekend that he would join the Leave campaign. A poll on the 17th of February showed that after PM Cameron, it is Johnson’s opinion that counts to voters the most. The pound surged late Friday following the deal, but opened with a gap down today, weighed on by Johnson’s remarks. In our view, this is likely to increase volatility in GBP even further, which could result in choppy trading going into the vote. We believe that the currency is now likely to be sensitive to the results of the incoming referendum polls. Market participants may begin carefully monitoring the release dates of these polls, as every headline could become cause for violent swings in sterling crosses. Having said that though, we would like to sound a note of caution on the ability of polls to predict the actual outcome of the vote, considering how poorly forecasters called the results of the last UK election.
• Today’s highlights: During the European day, we get the preliminary manufacturing and service-sector PMI data for February from several European countries and the Eurozone as a whole. All the indices are forecast to have declined, with the only exception being the French service-sector PMI which is expected to have remained unchanged. We believe that weak global demand have hurt the bloc’s manufacturing and service sectors. This could hurt the euro somewhat.
• From the US, we get the preliminary Markit manufacturing PMI for February. The index stands above the 50 barrier and expectations are for a fractional rise. However, both the Philadelphia Fed and Empire State manufacturing indices continued to point to a contraction in February and therefore, we see the possibility of a negative surprise. Anyhow, the market generally pays more attention to the ISM index which has been standing below the 50 mark for four consecutive months.
• We have one speaker scheduled today: ECB Executive Board member Sabine Lautenschlager.
• As for the rest of the week, on Tuesday, the German Ifo survey for February is coming out. The forecast is for all three indices to continue declining for the 3rd consecutive month. This would be in line with the ZEW survey for the same month, which showed that business optimism in Eurozone’s growth engine continued to be dragged down by the slowdown in China and other EM economies. This could add further selling pressure to the common currency, at least at the release.
• On Wednesday, we have no major events or indicators.
• On Thursday, the main event will be the 2nd estimate of the UK Q4 GDP. The forecast is for the revision to confirm the initial estimate. The first estimate showed that growth ticked up in Q4 from Q3, primarily driven by the service sector. However, the first estimate is compiled via the output approach, while the second one derives from the expenditure calculation. Throughout the quarter, retail sales were flat on average, while real wages have been slowing down. These signs make us believe that probably, private consumption was not strong enough to offset the very weak trade outlook. Therefore, we see the possibility for a downside revision.
• From the US, we get durable goods orders for January. Both the headline and core figures are forecast to have risen. Bearing in mind that industrial production rebounded in January after falling for 3 consecutive months, a rise in durable goods seems likely as well.
• On Friday, Japan’s CPI for January is due to be released and while there is no forecast for the headline figure, the core rate is expected to have declined to 0%. Although we could see the headline CPI to tick up a bit due to energy-related base effects, a fall in the core CPI could add more pressure on the BoJ to act again in the foreseeable future. A fall in the core rate could cause the yen to lose some of its recent steam.
• In Germany, the flash CPI is forecast to have slowed to +0.1% yoy in February, from +0.4% yoy previously. A decline in the German inflation rate could indicate a slowdown in the Eurozone’s CPI as well, due to be released the following week. ECB’s Draghi has already said inflation is expected to run low or negative in coming months, while Bank officials signaled their intention to ease further in March. Therefore, a fall in Euroarea’s inflation would confirm Draghi’s words and could increase the possibilities for additional stimulus by the Bank at its March meeting.
• From the US, we get the 2nd estimates of GDP and the core PCE deflator, both for Q4. GDP growth is expected to be revised down due to weaker business spending than previously expected, while the core PCE deflator is forecast to have remained unchanged from its initial estimate. Both personal income and personal spending for January are expected to have accelerated. The optimism among consumers was reflected in strong retail sales and that’s why we believe that personal spending will show a similar gain. This could add to last week’s gains of the greenback.
• Finally, G20 finance ministers and central bank governors will meet in Shanghai.
The Market
EUR/USD trades in a consolidative manner
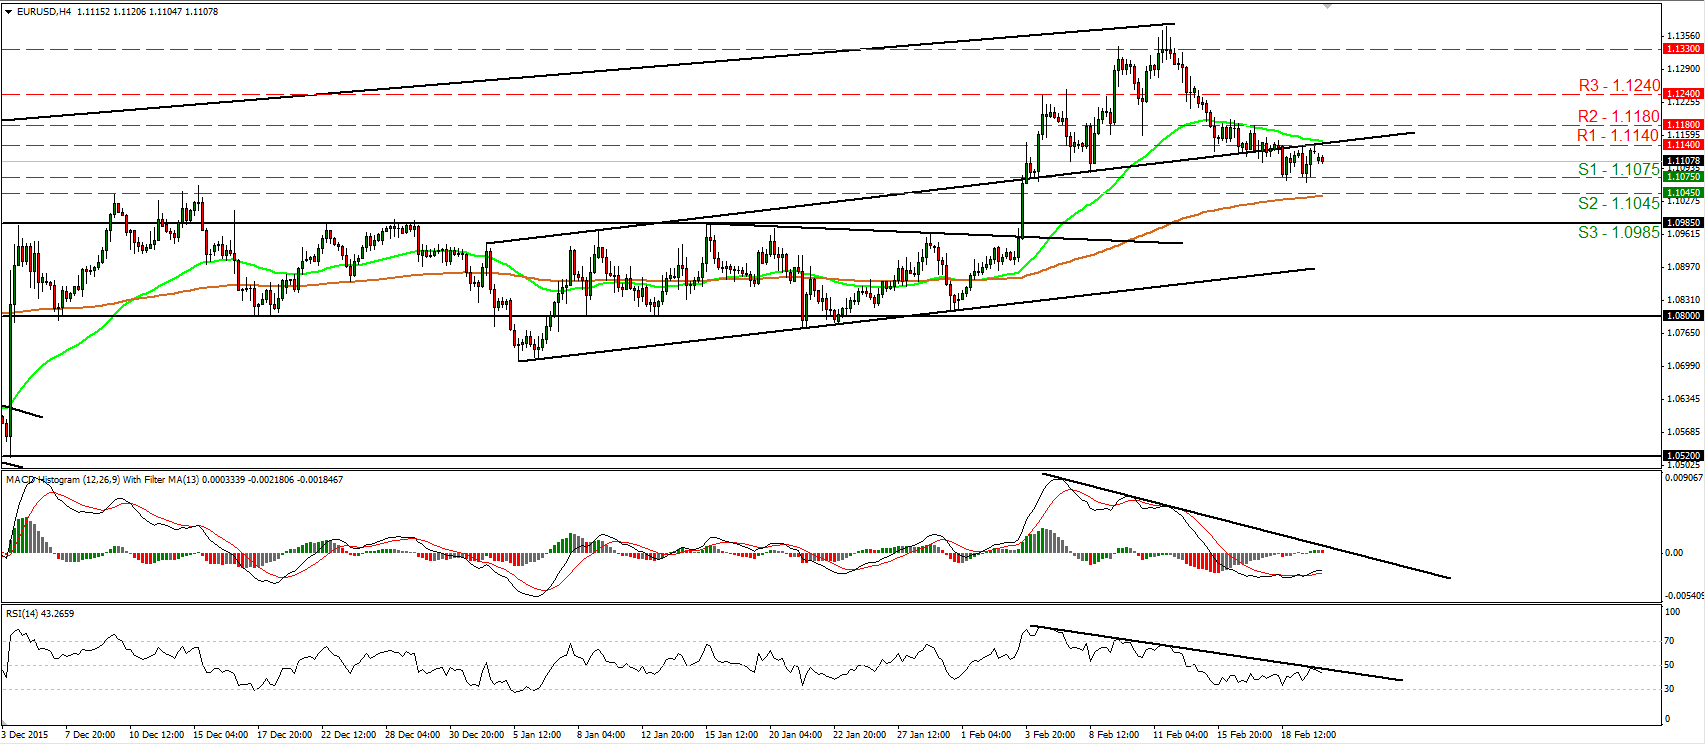
• EUR/USD traded in a consolidative manner on Friday, staying between the support of 1.1075 (S1) and the resistance of 1.1140 (R1). Given that the pair remains below the prior upside resistance line taken from the peak of the 4th of January, I would consider the short-term bias to be cautiously negative. A dip below the 1.1075 (S1) line could initially aim for the 1.1045 (S2) level and then for the key hurdle of 1.0985 (S3). Our short-term oscillators reveal negative speed and corroborate my view. The RSI hit resistance at its 50 line and turned down, while the MACD, already negative, shows signs that it could turn down as well and that it could fall below its trigger line any time soon. As for the broader trend, as long as EUR/USD is trading between the 1.0800 key zone and the psychological area of 1.1500, I would keep the view that the broader trend remains sideways.
• Support: 1.1075 (S1), 1.1045 (S2), 1.0985 (S3)
• Resistance: 1.1140 (R1), 1.1180 (R2), 1.1240 (R3)
GBP/USD gaps down after London Mayor joins “Brexit” camp
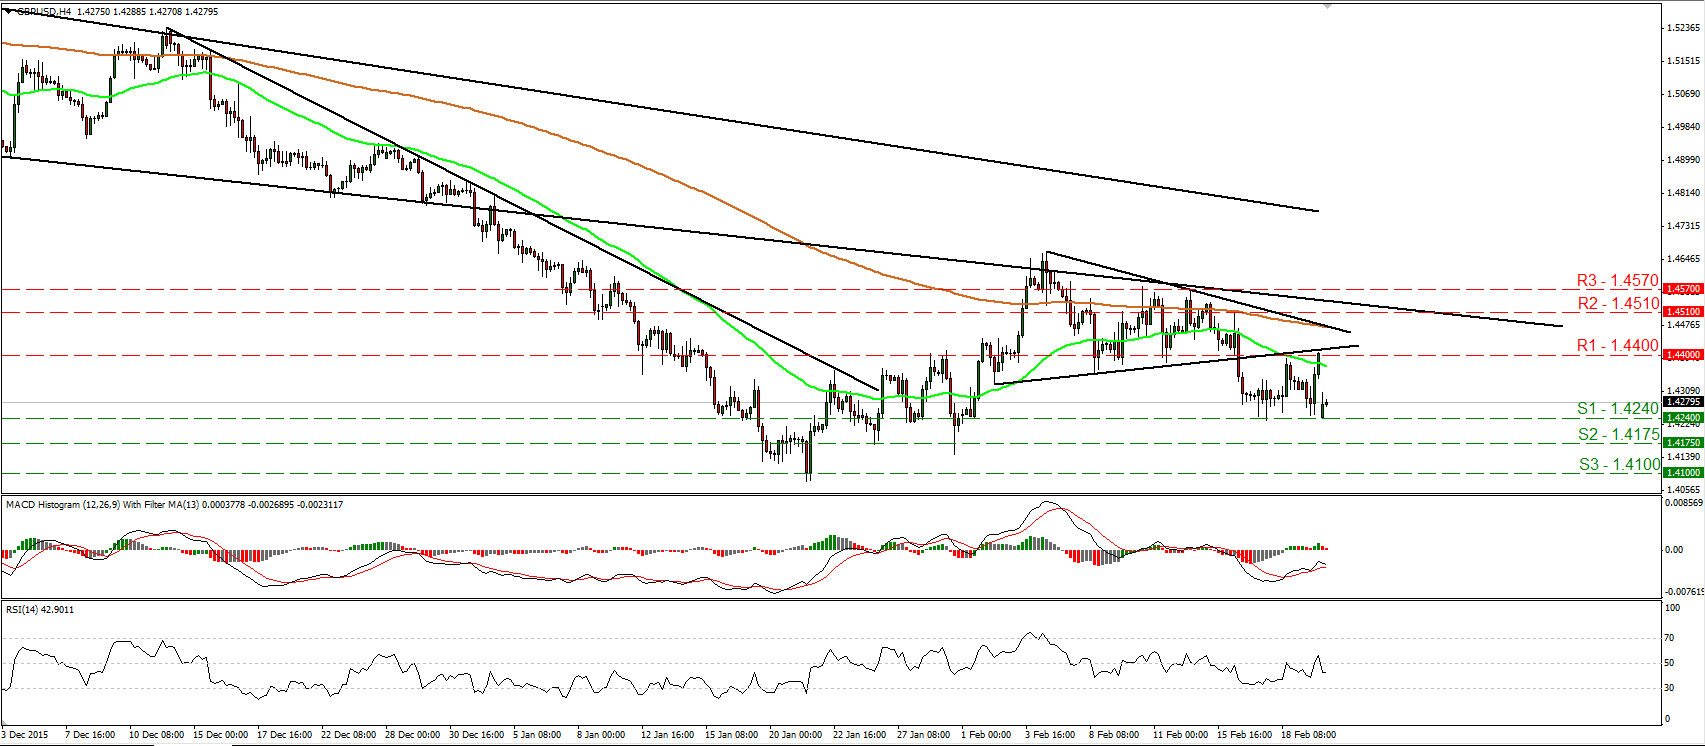
• GBP/USD traded higher on Friday after EU leaders manage to strike a deal to keep Britain in the union with a “special status”. Nevertheless, the rate hit resistance at the lower bound of the triangle that had been containing the price action from the 3rd until the 11th of February. Today, cable opened with a gap down as London Mayor Boris Johnson said he’ll campaign for Britain to leave the European Union. The fact that the rate remains below the lower bound of the triangle keeps the short-term outlook negative in my view. I would expect a clear dip below 1.4240 (S1) to aim for the next support zone of 1.4175 (S2). Our short-term momentum indicators support somewhat the notion. The RSI fell back below its 50 line, while the MACD, already negative, shows signs of topping. It could fall below its trigger line any time soon. Zooming out to the daily chart, I see that the price structure remains lower peaks and lower troughs below the 80-day exponential moving average, which is pointing down. Therefore, I still see a negative longer-term picture and I would treat the 21st of January – 4th of February recovery as a corrective phase for now.
• Support: 1.4240 (S1), 1.4175 (S2), 1.4100 (S3)
• Resistance: 1.4400 (R1), 1.4510 (R2), 1.4570 (R3)
EUR/JPY reaches the 125.00 barrier
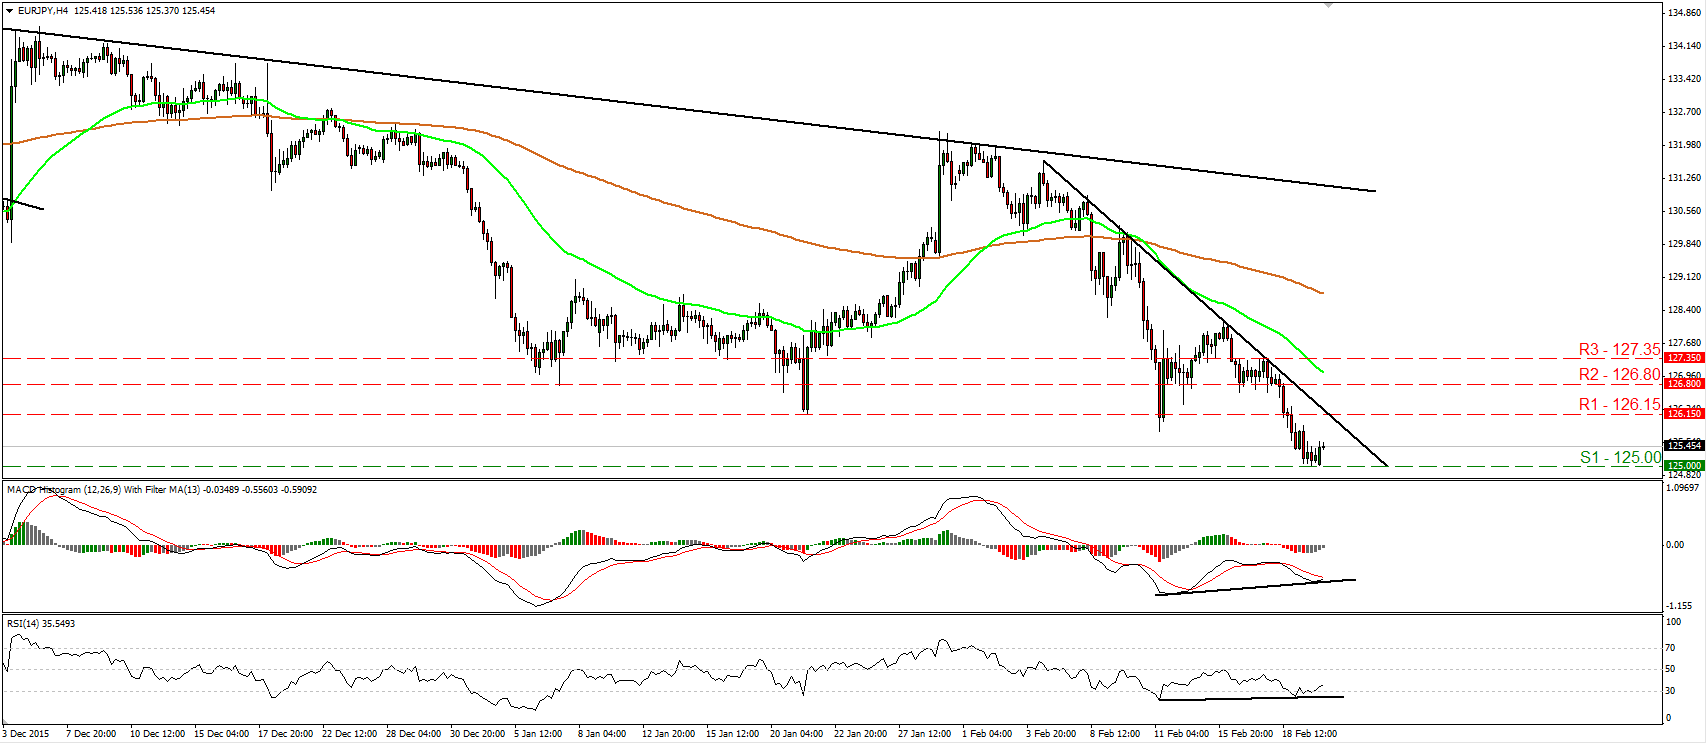
• EUR/JPY slid on Friday and managed to reach the psychological zone of 125.00 (S1) for the first time since June 2013. During the Asian morning Monday, the pair rebounded somewhat. As long as the pair is trading below the short-term downtrend line taken from the peak of the 4th of February, I would consider the near-term outlook to stay negative. A decisive dip below 125.00 (S1) could see scope for extensions towards the 124.00 (S2) level, defined by the inside swing high of the 25th of March 2013. Nevertheless, taking a look at our momentum studies, I see the likelihood for the current corrective bounce to continue for a while, perhaps to challenge the 126.15 (R1) hurdle as a resistance this time. The RSI exited its below-30 zone and is now pointing up, while the MACD has bottomed and now looks able to move above its trigger line. What is more, there is positive divergence between both these indicators and the price action. As for the broader trend, as long as the rate is printing lower peaks and lower troughs below the downtrend line drawn from the peak of the 21st of August, I would consider the longer-term picture to be negative as well.
• Support: 125.00 (S1), 124.00 (S2), 122.00 (S3)
• Resistance: 126.15 (R1), 126.80 (R2), 127.35 (R3)
Gold slides after hitting 1235
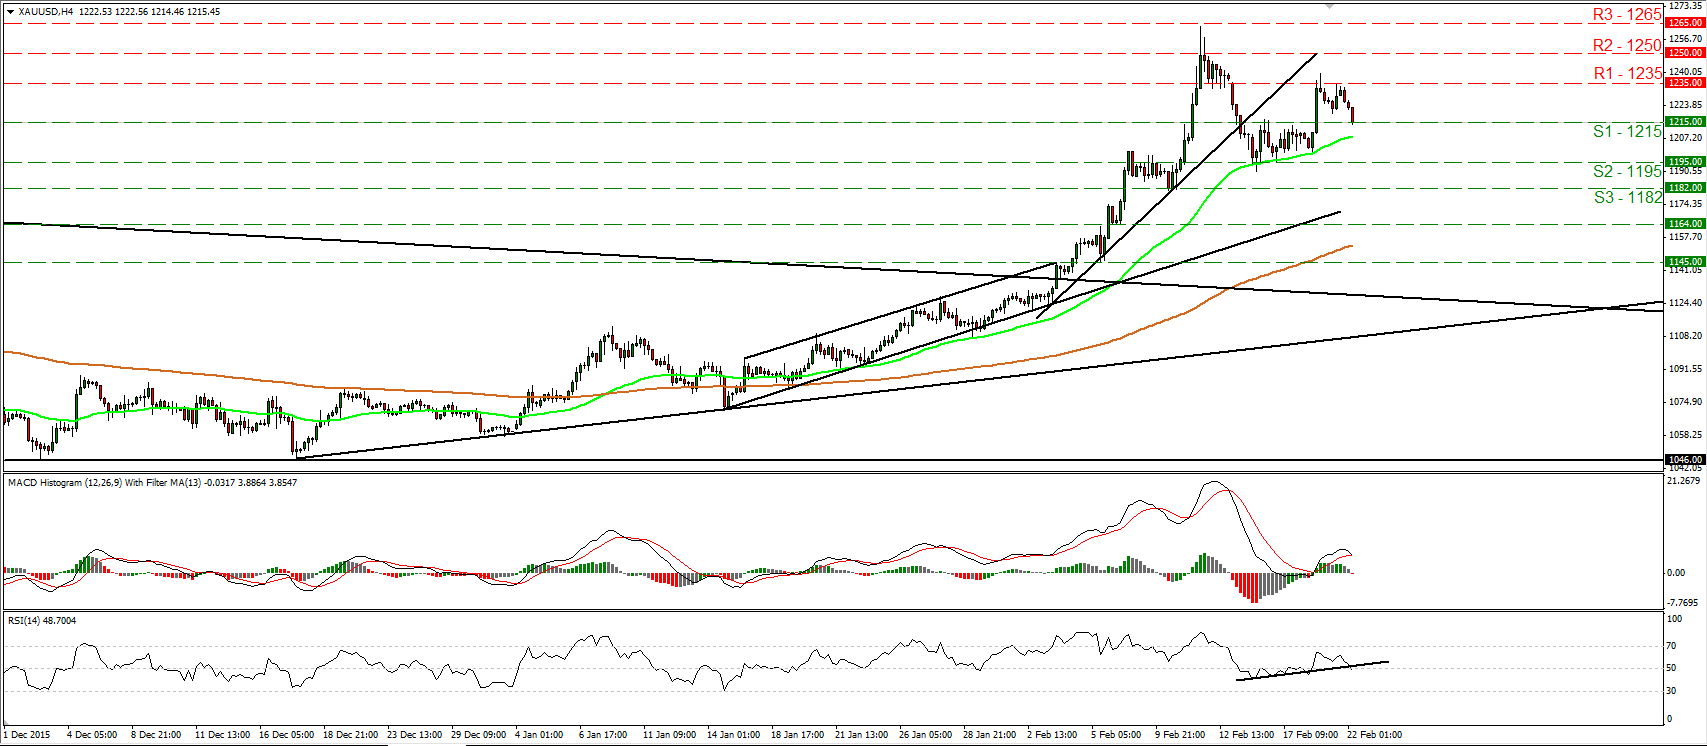
• Gold traded lower on Friday after it hit resistance at the 1235 (R1) hurdle. Today, during the early European morning, the metal is testing the 1215 (S1) support zone, where a clear break could set the stage for extensions towards our next support obstacle of 1195 (S2). Our oscillators detect downside speed and amplify the case for further declines. The RSI just crossed below 50 and below its upside support line, while the MACD, although positive, has topped and fallen below its trigger line. Switching to the daily chart, I see that on the 4th of February, the price broke above the long-term downside resistance line taken from the peak of the 22nd of January 2015. As a result, I would consider the medium-term outlook to be cautiously positive and I would treat any further near-term declines as a corrective phase for now.
• Support: 1215 (S1), 1195 (S2), 1182 (S3)
• Resistance: 1235 (R1), 1250 (R2), 1265 (R3)
DAX hits support at 9300
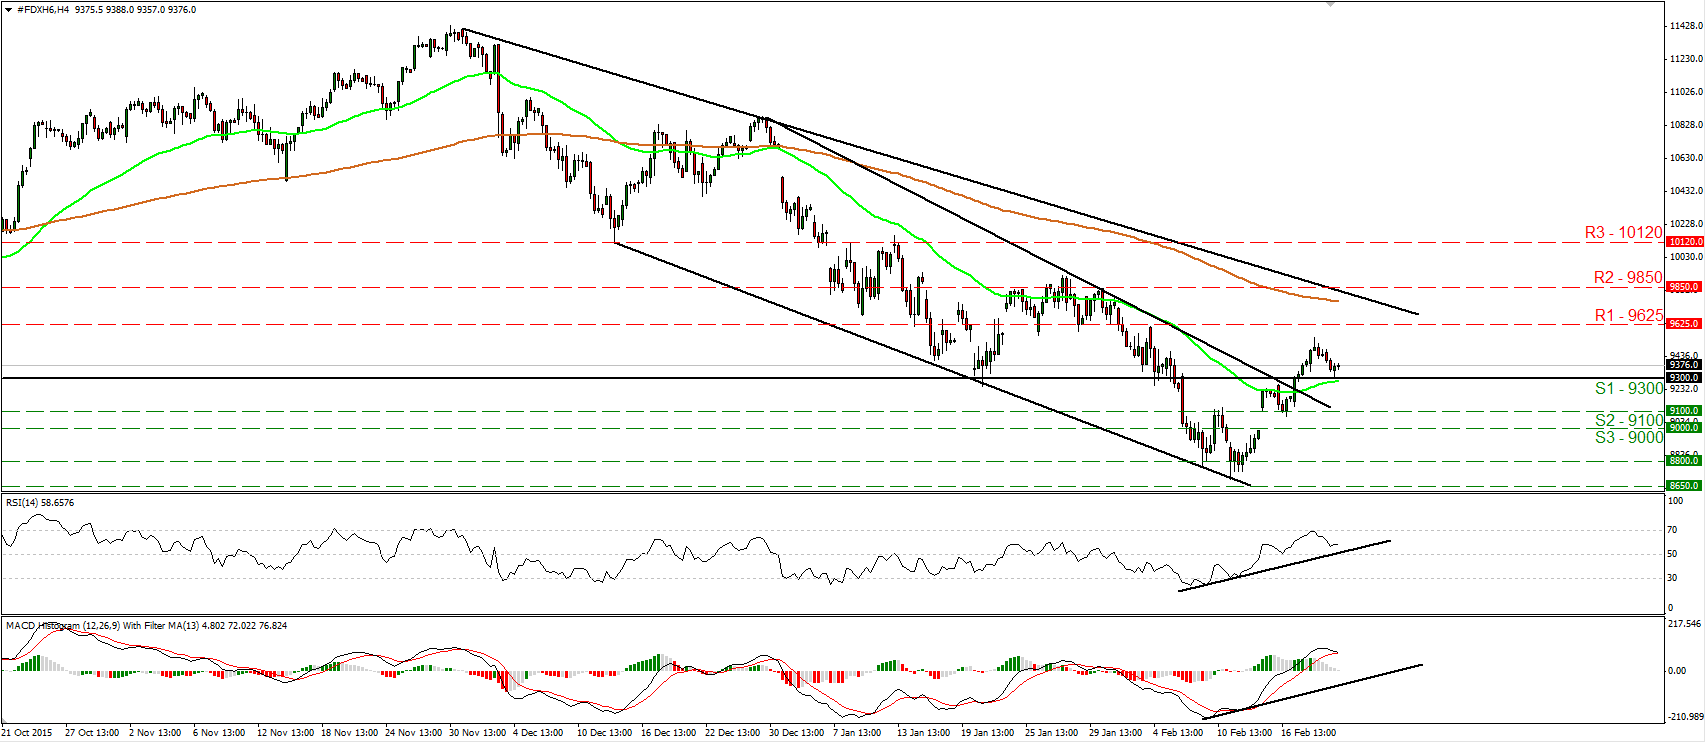
• DAX futures retreated on Friday and tested the 9300 (S1) key hurdle as a resistance this time. Last Wednesday, the index emerged above the downside resistance line taken from the peak of the 30th of December, and is still trading above that line. Therefore, I maintain the view that the short-term outlook remains cautiously positive. I would expect the bulls to take the reins near the 9300 (S1) area and perhaps target the resistance territory of 9625 (R1). A possible break above that resistance could open the way for the next obstacle of 9850 (R2).On the daily chart, I see that since the 1st of December the index has been printing lower peaks and lower troughs, something that keeps the longer-term picture negative. Therefore, I would treat the recovery from 8650, or any possible extensions of it, as a corrective move for now.
• Support: 9300 (S1), 9100 (S2), 9000 (S3)
• Resistance: 9625 (R1), 9850 (R2), 10120 (R3)


