I’ve written about several leading, lagging, and coincident indicators for the economy over the last year: Stocks, real estate, jobs, GDP – each says a different thing about the economy. People get confused by all these various indicators because they don’t understand the differences between them.
For example, how the hell do jobs keep growing, while retail sales go nowhere?
Some of the indicators are either lagging behind our economy’s path, or are so cracked up on financial drugs they’re no longer a reliable forecast of the future. Others paint a clearer economic picture. But I warn you – it isn’t a pretty one!
Leading indicators are things like the stock market that normally look ahead for signs of growth or decline. They used to predict economic movement a whole six to nine months in advance – hence, a “leading” indicator.
But with artificial QE driving the economy, they’ve been leading by just two months at best; if that. It’s like offering a lift to a drug addict you meet on the highway and accepting directions from him. It’s no longer a reliable leading indicator – more of a coincident one thanks to Fed manipulation of the economy.
Then we have a host of coincident indicators that have been pretty much flat at best. GDP still sucks at 1.45% for the first two quarters of 2015, lower than the mediocre 2% of the past six years. It was expected to be 3%-plus. Durable goods, manufacturing output, corporate earnings, and exports aren’t much better. And retail sales have been god-awful since last November – signs that the economy is slowing as we predicted. But at least these indicators are more reliable – just reliably bad for the future.
Finally there’s the lagging indicators like hiring and job growth. But like its name suggests, they show where an economy has been – not where it’s going. Businesses have been slow to hire since the economic downturn and waited for signs of more sustainable growth before making such major long-term commitments. Though lately, jobs growth has been better. But this always happens into the early stages of a downturn. Businesses continue to hire until the next slowdown grits its teeth. By then, it’s too late.
Real estate developers might be the worst example of this. They build like crazy… freak out when things crash… wait until an upturn is obvious… then build too much again. Like clockwork. Case in point: last month housing starts took a 9.8% jump. Huge! Unexpected!
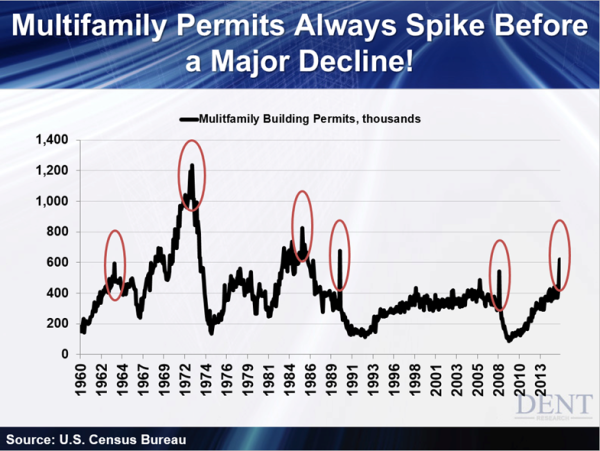
But get this – the jump was almost entirely in multifamily and rental properties. Those are in their prime now, but my demographic research shows demand for them will fall not too far ahead. That’s because the first wave of the echo boom generation is beginning to peak in its rental demand and will hit the summit between 2017 and 2018. After that, it’ll drop for seven years. Oops. Building too late again.
This chart shows how multifamily permits, the most leading of real estate indicators, tend to spike before a major contraction – every time!

That’s what happens. Real estate developers build the most when trends look the best – near the top – and/or when they want to lock in their loans at lower rates, fearing a rise in interest rates as the Fed starts tightening. And long-term rates have been rising over the last year, which is also a bad sign ahead.
I watched condos go up in Miami for two years after the great bust there. Everywhere there were empty condos. This lasted for years until the next bubble. And oh will that one burst too.
We’re in the midst of the last great bubble in real estate we’ll see for a long time. I promise you. Think about what will happen as developers overbuild multifamily and apartment units and their rents and sales value flop in the coming years. Imagine what that’ll do to single-family homes which have already struggled to come back. They’ll fare even worse in the coming downturn.
Don’t follow most of the classic leading indicators promising growth ahead. They don’t lead anymore. Don’t listen to economists basing their growth projections on lagging indicators like real estate and job growth. They’re behind the eight ball. Instead, look at the coincident indicators like retail sales that are saying a slowdown is already in progress…
Expect the second half of 2015 to be a bit slower than expected, again (maybe more)… And expect 2016 to unveil a slowdown more powerful than QE can fight off as the more affluent baby boomers finally tail off sharply in their spending like the average household did in 2008. The next perfect storm is building. Expect the great crash ahead to be worse than the one in 2008.
In fact, I suspect we’ll start to see a dramatic slowdown in stocks, and the economy to follow, by September of this year. Stocks will crash first (as in China recently). Then real estate and jobs – the lagging indicators – will follow. This should be the worst crash of our lifetimes, especially after such an extended debt and financial asset bubble sustained by artificial QE and money printing.
