On Monday, we wrote about how Japan’s GDP for Q4 was -6.3% vs an expectation of -3.7% expected. The data was horrible. Yet, yen pairs barely moved on the release, as markets know that the Japanese government will come in and save the day. Japan’s data hasn’t mattered for years now. However, enter concerns about the Coronavirus. Japan has seen a recent increase in the number of new cases, now over 600. This is the largest amount of people with the virus outside of China (however many of the cases were from the cruise ship Diamond Princess, which was quarantined at port in Japan). But Japan doesn’t want to take any chances. They have shut down events that would have large public attendance in order to stem contagion of the virus. In addition, Japan's health ministry issued guidelines for people exhibiting symptoms of the Coronavirus. With GDP at -6.3%, officials may already have to provide more stimulus. If there is a slowdown in economic activity because of the virus, things could get even worse. In addition, TOKYO IS SCHEDULED TO HOST THE SUMMER OLYMPIC GAMES. It would be a devastating blow to the economy if the games needed to be canceled.
Today’s price action in JPY pairs is particularly interesting. Yen pairs having been going bid all day. However, correlated assets such as gold and U.S. dollar index were also going bid and equity indices were moving lower. As of this writing, stocks look to be heading higher, perhaps restoring some order to the normal correlations.
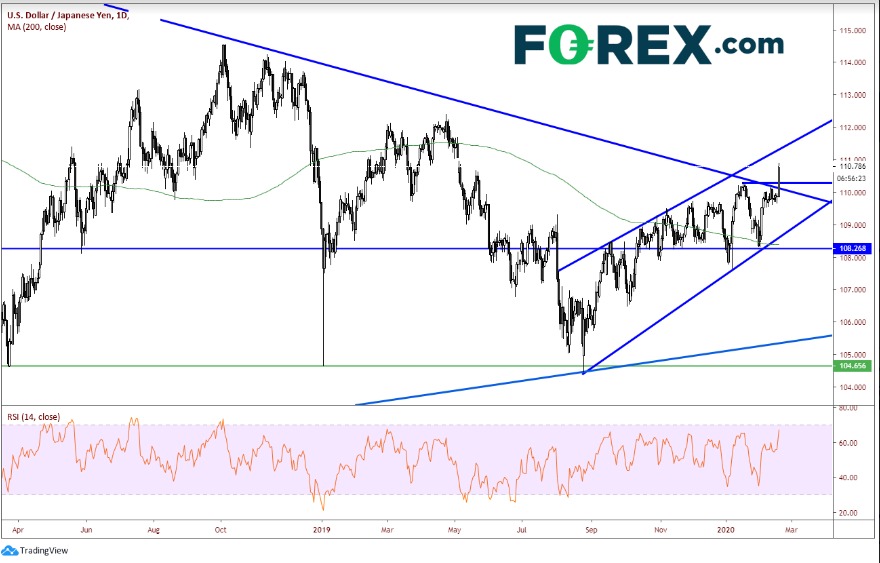
USD/JPY is up nearly 100 pips on the day close to 110.80, after breaking through strong resistance at 110.30. This was a confluence of resistance, including the break of a trendline that dated all the way back to June 2015. The next resistance level is the top trendline of the rising channel from August 2019, near 111.50. Support is back near the breakout point at 110.30.

Source: Tradingview, FOREX.com
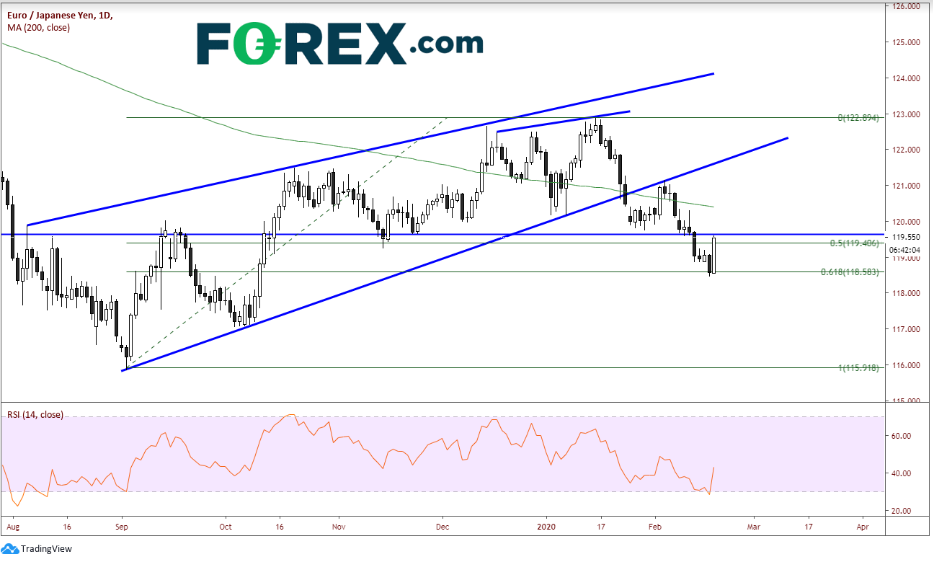
EUR/JPY is also up nearly 100 pips, close to 119.50. However due to the weak euro over the last few weeks, the pair is rising from depressed levels. EUR/JPY had pulled back to the 61.8% retracement level from the lows on September 3, 2019 to the highs on January 16 of this year at 118.50. However, there is horizontal resistance above near 119.60, then the 200-day moving Average at 120.40 and previous highs at 121.15. Support below is at the day’s lows near 118.55.

Source: Tradingview, FOREX.com
Whether today’s move in the yen pairs is due to a stop run/short squeeze, a delayed reaction to poor data or fears of the Coronavirus, it doesn’t matter. The reality is that yen pairs are moving higher. We need to look for confirmation in other correlated asset classes to determine if the move is “real.” If it is, we should see stocks continue higher, while gold and the USD move lower. Keep an eye on these assets for conviction.
