Banks have attracted special attention during the current period of socio-economic turbulence because of their deep involvement in both financial and economic components of the crisis. In 2009, we investigated and revealed the reasons behind bankruptcy of major banks and have been reporting on the evolution of many to-big-to-fall institutions since then.
In March 2012, we presented a brand new model for JPMorgan Chase & Co. (JPM) stock price and predicted a negative correction in April/May. This forecast was correct: the (monthly closing) price increased from $38.38 in February to $44.97 in March and then fell to $42.31 in April and to $32.63 in May.
The closing price in October 2012 was $41.68, which is approximately $2 higher than predicted. Our updated model again shows the possibility of a negative correction in November-December down to $38. On November 17, the closing price is $39.53. We would not recommend buying JPM shares and consider them as reaching some stability level at a two month horizon, which is a natural horizon for our quantitative model.
JPM is a company from financial sector which provides various financial products and services worldwide. The model has been obtained using our general concept of share pricing as based on a decomposition of a share price into a weighted sum of two consumer price indices. Our main assumption is a natural one – all goods and services produced (provided) by a given company should define the share price evolution relative to other companies. In other words, relative pricing power of the company is related to the pricing power of its G&S. Since other companies are also driven by prices for their goods and services, which compete with the studied company, one need two defining sets of G&S to estimate the relative pricing power. Presumably, the studied share price can be defined by two CPIs.
The best CPIs are selected from a set of 92 CPIs with estimates available from 2000. In the tentative model presented in March 2012, the best fit (in the LSQ sense) consumer price indices are that of food and beverages (F) and the index of owner’s equivalent rent of residence (ORPR). In the updated model, the defining CPIs are the same and time lags of the price behind the CPIs are as follows: the food index led the share price by 4 months and the ORPR index led by 2 months. The tentative and updated models are as follows:
JPM(t) = -1.99F(t-3) + 1.15ORPR(t-2) + 6.81ORPR(t-1990) + 39.30, February 2012
JPM(t) = -1.86F(t-4) + 0.99ORPR(t-2) + 7.04(t-2000) + 116.91, October 2012
where JPM(t) is the JPM share price in U.S. dollars, t is calendar time. As both models show, the increasing food index suppresses the share price and the rent index drives it up. Any big jump in food price results in a sharp fall in JPM price in four months. It is worth noting that we present only those price models which are stable over longer periods of seven and more months. This means that all models obtained since February 2012 are defined by the same CPIs with the same time lags when only contemporary data are used. The tentative model also covered the period seven months before February 2012. This makes the presented model to be the best in the LSQ sence since August 2011.
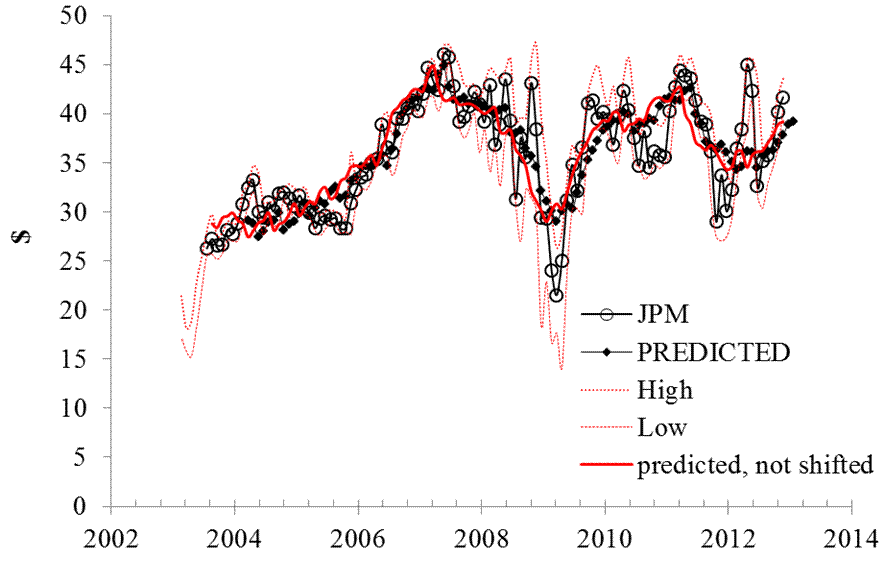
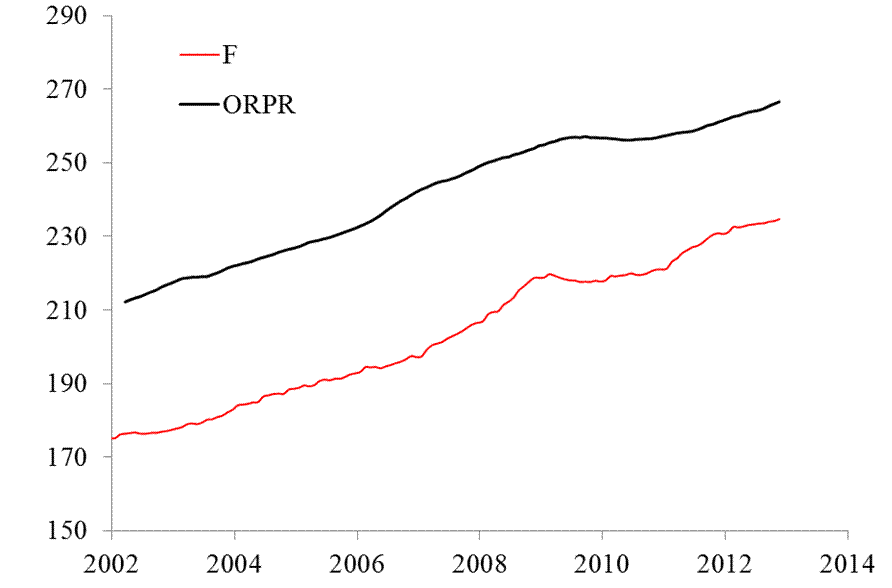
Figure 1 displays the evolution of both defining indices since 2002. Figure 2 depicts the high and low monthly prices for a share together with the predicted and measured monthly closing prices (adjusted for dividends and splits). The measured price volatility is much higher than the predicted one. This means that large deviations from the predicted level are possible but such excursions are always ended on the predicted curve. One can use this observation for a qualitative forecast of price movements as we did in March 2012 and do in this post. The current deviation of the JPM price from its predicted level could be interpreted as a temporary one with the following return and dive below the line (dynamic overshooting) as was observed many times since 2003.
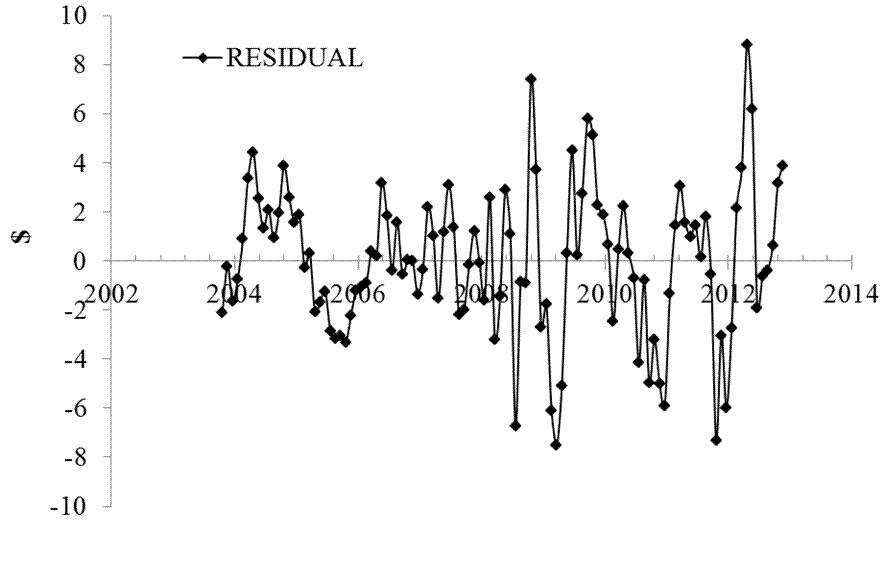
The updated model validates the tentative one by the data measured during the eight month period. The model residual error is shown in Figure 3 with the standard deviation between July 2003 and October 2012 of $2.96.


- English (UK)
- English (India)
- English (Canada)
- English (Australia)
- English (South Africa)
- English (Philippines)
- English (Nigeria)
- Deutsch
- Español (España)
- Español (México)
- Français
- Italiano
- Nederlands
- Português (Portugal)
- Polski
- Português (Brasil)
- Русский
- Türkçe
- العربية
- Ελληνικά
- Svenska
- Suomi
- עברית
- 日本語
- 한국어
- 简体中文
- 繁體中文
- Bahasa Indonesia
- Bahasa Melayu
- ไทย
- Tiếng Việt
- हिंदी
JPMorgan Chase: Slightly Overvalued
Published 11/18/2012, 04:52 AM
Updated 07/09/2023, 06:31 AM
JPMorgan Chase: Slightly Overvalued
Latest comments
Loading next article…
Install Our App
Risk Disclosure: Trading in financial instruments and/or cryptocurrencies involves high risks including the risk of losing some, or all, of your investment amount, and may not be suitable for all investors. Prices of cryptocurrencies are extremely volatile and may be affected by external factors such as financial, regulatory or political events. Trading on margin increases the financial risks.
Before deciding to trade in financial instrument or cryptocurrencies you should be fully informed of the risks and costs associated with trading the financial markets, carefully consider your investment objectives, level of experience, and risk appetite, and seek professional advice where needed.
Fusion Media would like to remind you that the data contained in this website is not necessarily real-time nor accurate. The data and prices on the website are not necessarily provided by any market or exchange, but may be provided by market makers, and so prices may not be accurate and may differ from the actual price at any given market, meaning prices are indicative and not appropriate for trading purposes. Fusion Media and any provider of the data contained in this website will not accept liability for any loss or damage as a result of your trading, or your reliance on the information contained within this website.
It is prohibited to use, store, reproduce, display, modify, transmit or distribute the data contained in this website without the explicit prior written permission of Fusion Media and/or the data provider. All intellectual property rights are reserved by the providers and/or the exchange providing the data contained in this website.
Fusion Media may be compensated by the advertisers that appear on the website, based on your interaction with the advertisements or advertisers.
© 2007-2025 - Fusion Media Limited. All Rights Reserved.
