Third-quarter earnings season is about to get underway, with big-cap bank JPMorgan Chase & Co. (NYSE:JPM) set to take its turn in the spotlight ahead of the open tomorrow, Oct. 12. The financial stock has been relatively quiet over the last two months, per its 60-day historical volatility of 15% -- in the low 15th percentile of its annual range. The options market, however, is pricing in a bigger-than-usual swing for tomorrow's trading.
Most recently, Trade-Alert pegged the implied daily earnings move for JPM at 4.6%, much larger than the 1.1% next-day move the stock has averaged over the last two years. The bulk of this action has occurred to the downside, with the equity closing lower in the session immediately following earnings in six of the last eight quarters. However, not one of these last eight earnings reactions was large enough to exceed the expected move the options market is currently pricing in for JPM.
Options traders appear to be betting on a rare post-earnings pop for the bank stock. At the International Securities Exchange (ISE), Chicago Board Options Exchange (CBOE), and NASDAQ OMX PHLX (PHLX), JPMorgan's 10-day call/put volume ratio of 3.34 ranks in the 94th annual percentile, meaning calls have been bought to open over puts at a quicker-than-usual clip.
The November 120 call has seen a notable rise in open interest over this two-week time frame, and data from the major options exchanges confirms significant buy-to-open activity at this out-of-the-money strike. In other words, speculators are betting on JPM to break out to new heights above $120 by the close on Friday, Nov. 16, when the back-month options expire.
Short-term bets are pricing in elevated volatility expectations at the moment, per JPM's 30-day at-the-money implied volatility (IV) of 26.9% -- in the 94th percentile of its annual range. Meanwhile, the equity's 30-day IV skew of 32.9% ranks in the 99th percentile of its 12-month range, meaning near-term calls have rarely been cheaper than puts, on a volatility basis.
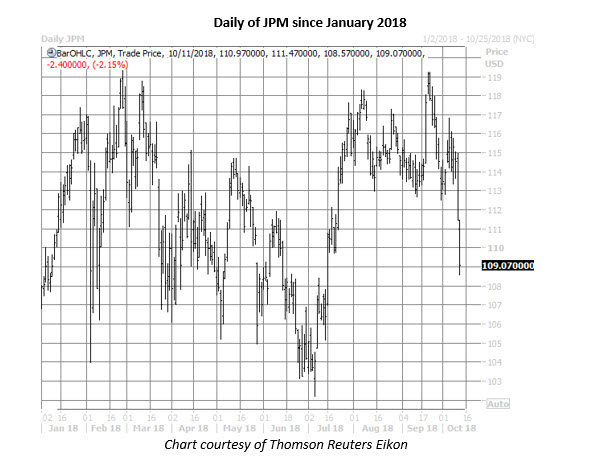
Looking at the charts, the highest JPMorgan Chase stock ever traded was $119.33 back on Feb. 27. The shares went on to hit a year-to-date low of $102.20 on July 6. JPM rallied back up near $118 by mid-August, and spent the next two months chopping around this region. However, the broad-market sell-off this week has the bank shares now trading near levels not seen since mid-July, with JPM down 2.1% today at $109.07.

