Introduction
The Fed is dealing with a number of issues. It wants to increase interest rates. At the same time, it has started to sell off assets it accumulated after the 2008 US banking collapse. At the same time, the US budget deficit will grow significantly over the coming years as a result of the recent tax cut. The investment implications of all of this are considered here.
For many years, John Mauldin has been one of my favorite economic gurus. He worries a lot, and some of his recent worries merit attention. They involve various conflicting pressures on and effects of Fed policies in coming years. I quote from his piece, “Enjoy It While You Can”:
As I look at the data and talk to my contacts, I’m beginning to conclude that we’re approaching one of those transitional phases. I think we’ll look back at 2018 as an in-between year… from good times to something eventually not so good.
Now, let me stress that I’m not predicting imminent doom. As you’ll see below, I think the party can last another year, maybe even longer. But I do see storm clouds on the horizon, and they’re blowing our way.
Mauldin starts by noting the Fed is now concerned about the economy overheating and plans to increase interest rates in a series of steps over the next few months. Further, he says the Fed is committed to “quantitative tightening” (QT) by selling off a significant share of the assets ($1.7 trillion) purchased during the “quantitative easing” era (QE) that started after the 2008 banking collapse. I again quote Mauldin:
Even though they told us, and most of us believe, that QE was responsible for the inflation of asset prices across the board, somehow QT is not supposed to have the opposite effect….I can understand the Fed’s raising rates from the near-zero level to something more normal. That makes sense. What we don’t need is to raise rates and wean the bond market off its quantitative easing bottle at the same time. Yet that is what the Fed is doing.
The Fed started QT in the last quarter of 2017. It reportedly will increase its sales by $10 billion each month until it is selling $50 billion monthly.
And then there is the additional new borrowing that will be required by Trump’s tax cuts. According to the Committee for a Responsible Federal Budget, the plan could cost $3 to $7 trillion over a decade; its base-case estimate is $5.5 trillion in revenue loss over a decade, or approximately $500 billion annually.
Putting this altogether, we have:
- The QT asset sale of $50 billion monthly or $600 billion annually;
- The need to borrow $500 billion annually from the tax cut and
- The Fed wanting to increase interest rates.
I quote Mauldin again on the need to borrow more:
The US debt is officially $20,622,176,525,000 as I write this: $20.6 trillion. We could be easily north of $22 trillion going into 2019 (or at least scaring $22 trillion) if the economy is supposedly still doing well. What happens when we go into recession? We will be at $30 trillion in total debt within three to four years. Using government projections, we could easily be there, even without a recession, shortly after the middle of the next decade.
And there are derivative issues that might be problematic. Higher rates will slow home buying. But more worrying to me is what these new Federal debt issuances will have on global demand for US debt. It should be kept in mind that one of the US’s “greatest” exports is US debt, even though it is not included as an “export” in our international trade accounts. In fact, the US is special because the negative trade deficit is in part a reflection of the demand for US debt and securities. A brief primer on all of this follows.
Analytics
a. Domestic Effects
Looking a bit closer at what is going to happen:
- The Fed’s QT actions will be deflationary. In contrast to stimulatory QE policies, the Fed’s selling of $1.7 trillion of assets will reduce the dollar money supply in circulation as the Fed takes in dollars for the sale of assets.
- The tax reductions, estimated at $500 billion annually, will provide a stimulus. And recipients of the reductions will spend at least some of them. The data underscore concerns by some economists that Republican tax cuts enacted this year could increase the US government debt load, which has surpassed $20 trillion. The tax changes are expected to reduce federal revenue by more than $1 trillion over the next decade, while a $300 billion spending deal reached by Congress in February could push the deficit higher. The FocusEconomics’ Consensus Forecast has the US Federal government deficit rising from 3.4% of GDP to as much as 5.7% in 2019.
b. International Repercussions
As noted above, capital flows have in the past been viewed as “adjustment items” in international trade accounts. But the US experience is quite different than any other country. This is because just as is the case with US exports goods and services, there has been a global demand for US government debt and equities. Indeed, for some years, US capital inflows have exceeded the US trade deficit. Table 1 provides data on the ten largest holders of US equities and debt.
Table 1. – Foreign Holdings of US Equities and Debt, 2017
(billions USd)
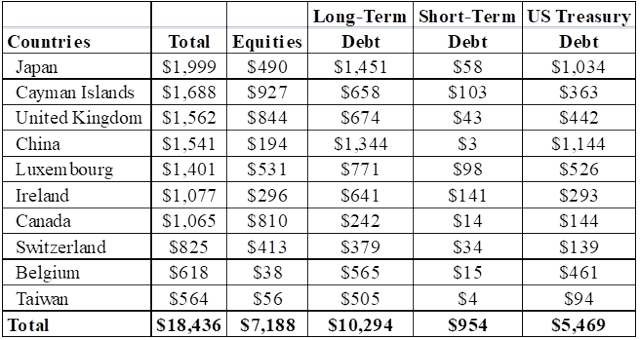
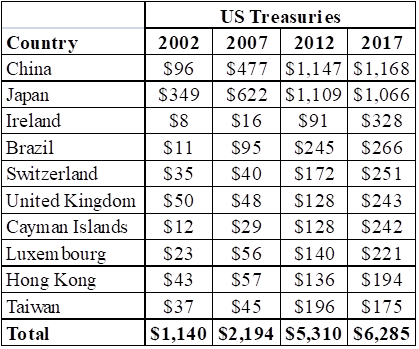
Table 2 provides the largest holders of US Treasuries. One thing that is different between international exports in goods/services and trade in securities is that the latter can be liquidated instantly. And one does have to wonder just how long foreigners, in light of the failure of the US government showing any fiscal restraint, will continue to buy and not liquidate their debt holdings. Of course, this is very much like banks becoming the friends of their largest lenders. Holders of US debt do not want to see the value of their holdings reduced because of selling.
Table 2. - Foreign Holdings of US Government Debt
(billions of USD)
Investment Implications
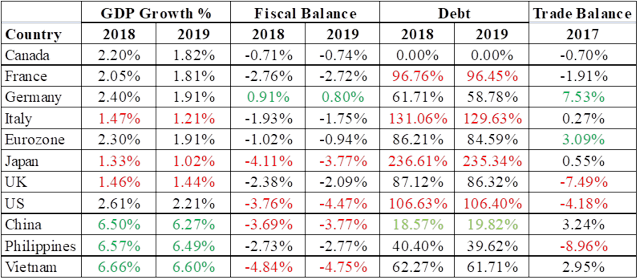
With uncertainties surrounding the economic policies of the current US President, predictions are dangerous. However, from what has been said above it is likely that US interest rates will increase and the dollar’s value will weaken. That suggests investing at least a portion of your portfolio in non-dollar assets. That way, you will benefit from the weaker dollar. Table 3 provides economic data from the FocusEconomics’ database. I have highlighted “good” indicators in green and problematic ones in red. Projected economic growth in Asia is special relative to the rest of the world. And with great uncertainty in Europe about Brexit and other issues, emerging markets are worth considering for investments. China in particular appears to have strong economic prospects.
Table 3. – Economic Indicators of Selected Countries
With all this in mind, it is probably worth considering investing elsewhere. In what follows, I offer possible ETF and mutual fund opportunities for emerging markets. Some Chinese-specific investment possibilities are also presented.
Table 4 is a listing of some of the better-performing emerging market ETFs.
Table 4. – Emerging Market ETFs
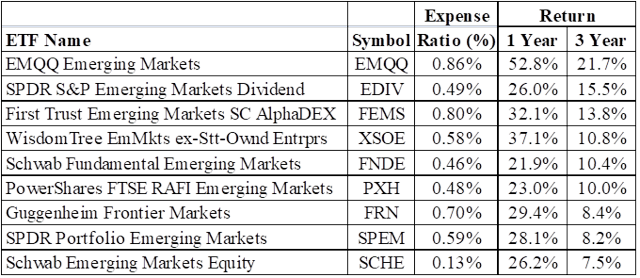
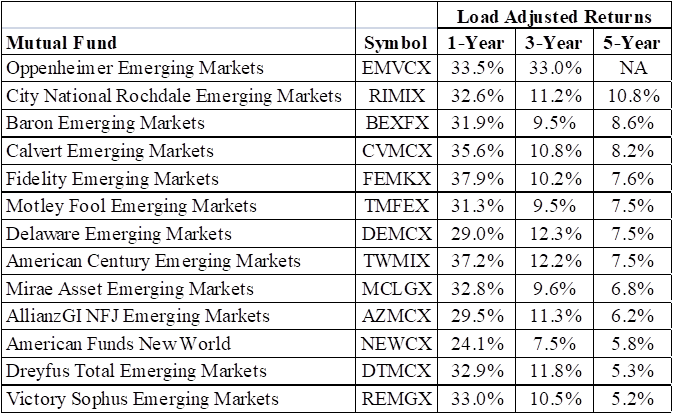
Table 5 provides return data on a selection of emerging market mutual funds. This last year was clearly great for both.
Table 5. – Emerging Market Mutual Funds
Regarding China, take a look at the Guggenheim China Technology ETF (NYSE:CQQQ). It has a three year annual rate of return of 22%. The Guggenheim China Real Estate ETF (NYSE:TAO) is also attractive with a three year annual return of 15%. I also like the Matthews China Investor (MCHFX) mutual fund with a three year load adjusted return of almost 17%.
Disclosure:I am/we are long CQQQ, TAO, MCHFX. I wrote this article myself, and it expresses my own opinions. I have no business relationship with any company whose stock is mentioned in this article.
