It comes as no surprise to me that many believe we are in a recession. Joe Sixpack’s portion of the economy sucks (e.g. not good, for those who are uncertain what “sucks” means).
The metric used to gauge economic growth by APP (Academics, Pundits and Politicos) is GDP (Gross Domestic Product). It includes elements which have no direct relationship to Joe. GDP is a metric to understand the economy of the 0.01%, or the country as a whole. Joe lives in a world of income, expenditure and net worth. If Joe sees growth in his world, then his economy is growing.
Joe’s world is contracting – literally. Joe’s world is in a recession. Instead of looking at aggregate growth, the way to view Joe’s world is to look at per capita growth, and specifically at the money flows that involve Joe directly.
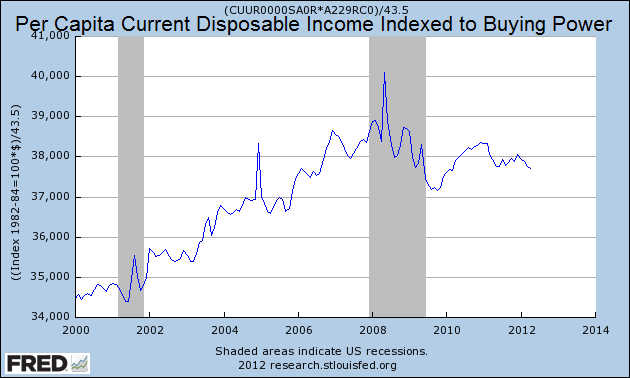
The graph below shows April 2012 per capita disposable income 0f $37,711 (current dollars) indexed to the buying power of the dollar. Joe’s world is operating at the same levels as five years ago. This is Joe’s REAL income growth – and it shows Joe’s real income is shrinking.
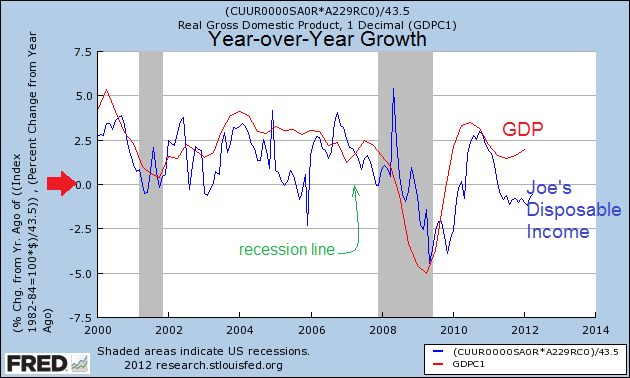
Taking the data in the above graph, and comparing growth year-over-year with GDP – I argue that Joe’s world has been shrinking since mid 2011 – just as the establishment was telling Joe the economy is growing.
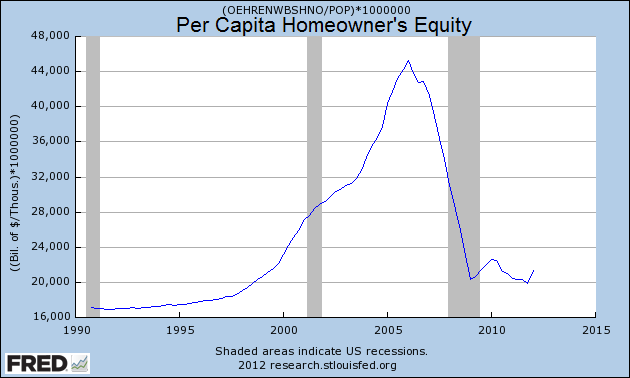
And Joe’s assets suck. Joe’s primary asset is his house. Although pundits (including me) are telling you the housing market has bottomed, there is a big difference between a “bottom” and a “recovered” market. Joe on average is worth half as much as he was before the Great Recession.
My view continues to be that the economy overall is in a depression at least since the beginning of 2008. A depression per Wikipedia:
Considered by some economists to be a rare and extreme form of recession, a depression is characterized by its length; by abnormally large increases in unemployment; falls in the availability of credit, often due to some kind of banking or financial crisis; shrinking output as buyers dry up and suppliers cut back on production and investment; large number of bankruptcies including sovereign debt defaults; significantly reduced amounts of trade and commerce, especially international; as well as highly volatile relative currency value fluctuations, most often due to devaluations. Price deflation, financial crises and bank failures are also common elements of a depression that are not normally a part of a recession.
Economic metrics should be based on what the average Joe is experiencing – shrinking buying power and assets contracting in value. GDP is the wrong tool with which to look at Joe’s world.
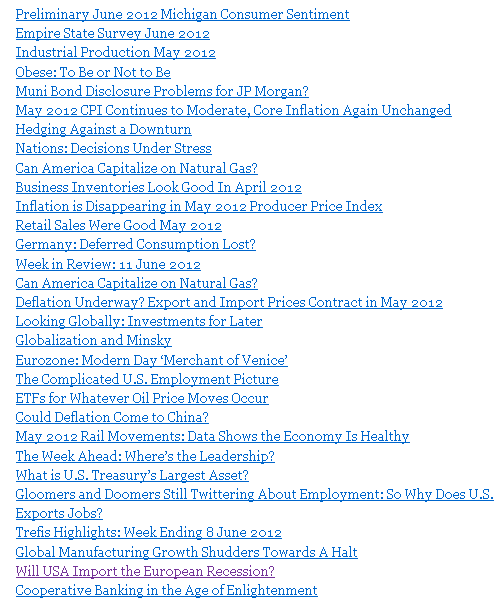
Other Economic News this Week:
The Econintersect economic forecast for June 2012 continues to show moderate growth – although marginally weaker. There was degradation both in our government pulse point,and in some of our transport related pulse points. There are no recession flags showing in any of the indicators Econintersect follows which have been shown to be economically intuitive.
ECRI has called a recession. Their data looks ahead at least 6 months and the bottom line for them is that a recession is a certainty. The size and depth is unknown but the recession start has been revised to hit around mid-year 2012.
The ECRI WLI index value has been jumping around due to backward revision – and this week it has solidly entered negative territory. The index is indicating the economy six month from today will be slightly worse than it is today. 
Initial unemployment claims increased from 377,000 (reported last week) to 386,000 this week. Historically, claims exceeding 400,000 per week usually occur when employment gains are less than the workforce growth, resulting in an increasing unemployment rate (background here and here). The real gauge – the 4 week moving average – rose from 377,750 (reported last week) to 382,000. Because of the noise (week-to-week movements from abnormal events AND the backward revisions to previous weeks releases), the 4-week average remains the reliable gauge.
Data released this week which contained economically intuitive components (forward looking) were rail movements (which is still indicating a moderate expansion if one ignores coal) and Industrial Production’s manufacturing sub-index (which shows slower growth). Econintersect does not see any other data release this week as particularly intuitive in understanding future economic conditions.
Weekly Economic Release Scorecard:
Click here to view the scorecard table below with active hyperlinks.
News Releases this Week:
Bankruptcies this Week: Allied Systems Holdings, Northstar Aerospace’s U.S. subsidiaries [Northstar Aerospace (USA), Northstar Aerospace (Chicago), Derlan USA and D-Velco Manufacturing of Arizona]
- English (UK)
- English (India)
- English (Canada)
- English (Australia)
- English (South Africa)
- English (Philippines)
- English (Nigeria)
- Deutsch
- Español (España)
- Español (México)
- Français
- Italiano
- Nederlands
- Português (Portugal)
- Polski
- Português (Brasil)
- Русский
- Türkçe
- العربية
- Ελληνικά
- Svenska
- Suomi
- עברית
- 日本語
- 한국어
- 简体中文
- 繁體中文
- Bahasa Indonesia
- Bahasa Melayu
- ไทย
- Tiếng Việt
- हिंदी
Joe Sixpack’s Economy Is Already In A Recession
Published 06/17/2012, 12:05 AM
Updated 05/14/2017, 06:45 AM
Joe Sixpack’s Economy Is Already In A Recession
Latest comments
Loading next article…
Install Our App
Risk Disclosure: Trading in financial instruments and/or cryptocurrencies involves high risks including the risk of losing some, or all, of your investment amount, and may not be suitable for all investors. Prices of cryptocurrencies are extremely volatile and may be affected by external factors such as financial, regulatory or political events. Trading on margin increases the financial risks.
Before deciding to trade in financial instrument or cryptocurrencies you should be fully informed of the risks and costs associated with trading the financial markets, carefully consider your investment objectives, level of experience, and risk appetite, and seek professional advice where needed.
Fusion Media would like to remind you that the data contained in this website is not necessarily real-time nor accurate. The data and prices on the website are not necessarily provided by any market or exchange, but may be provided by market makers, and so prices may not be accurate and may differ from the actual price at any given market, meaning prices are indicative and not appropriate for trading purposes. Fusion Media and any provider of the data contained in this website will not accept liability for any loss or damage as a result of your trading, or your reliance on the information contained within this website.
It is prohibited to use, store, reproduce, display, modify, transmit or distribute the data contained in this website without the explicit prior written permission of Fusion Media and/or the data provider. All intellectual property rights are reserved by the providers and/or the exchange providing the data contained in this website.
Fusion Media may be compensated by the advertisers that appear on the website, based on your interaction with the advertisements or advertisers.
© 2007-2025 - Fusion Media Limited. All Rights Reserved.
