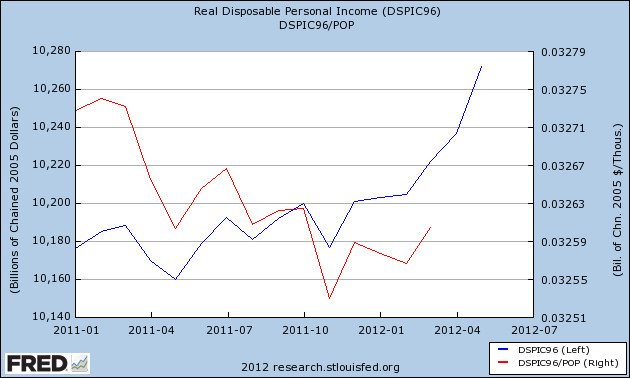
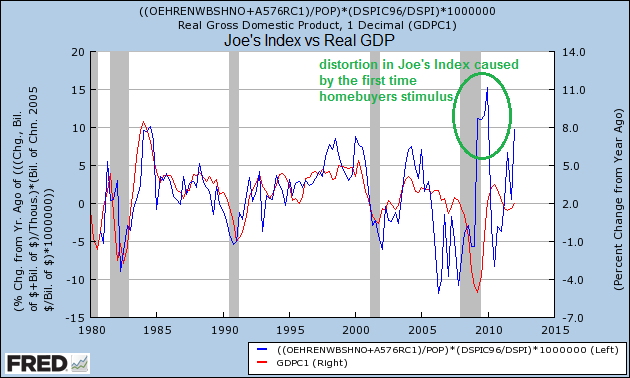
The New York Times this week posted Consumers Unlikely to Rekindle the Recovery. To “prove” their point they presented three nasty but unfortunately correct graphics.
This NYT post presented reasons for optimism as well, and we believe fairly presented the current situation. Forward looks at the economy are educated guesses – there are no proven formulas.
If you look closely at the first graphic (for disposable income), you will notice a slight uptick at the end. The downward trend in disposable income has been broken for at least one month – both on a real and per capita basis.
Econintersect has been playing with an economic index based on the world as seen by Joe Sixpack. For lack of a final name, we have used a development tag of “Joe’s Index”. Joe’s Index is indicating Joe Sixpack is coming back to the consumption trough. 
We believe the Joe’s Index leads GDP in both trend and exaggerated intensity. More time will test this belief. Joe’s Index is based on Joe’s real income and the change in his home value, which, to various degrees, Joe sees as income (and/or wealth) gain or loss.
At this point the index is only telling us that Joe Sixpack should have expanded consumption in 2Q2012. Joe’s Index needs to be refined further to estimate home prices in real time. As things stand now, Joe’s Index has a data lag of one quarter. This improvement will allow vision into 3Q2012.
For now, the economic trends are not all negative – and the future USA economy is not written in stone irrespective of pundits’ opinions.
Other Economic News this Week:
The Econintersect economic forecast for July 2012 continues to show moderate growth. Overall, trend lines seem to be stable even with the fireworks in Europe, and emotionally one cannot help thinking this is the calm before the storm. There are no recession flags showing in any of the indicators Econintersect follows which have been shown to be economically intuitive. There is no whiff of recession in the hard data – even though certain surveys are at recession levels.
ECRI stated in September 2011 a recession was coming . Their data looks ahead at least 6 months and the bottom line for them is that a recession is a certainty. The size and depth is unknown but the recession start has been revised to hit around mid-year 2012.
The ECRI WLI index value is again tip-toeing in negative territory – but this week is “less bad”. The index is indicating the economy six month from today will be slightly worse than it is today. As shown on the graph below, this is not the first time since the end of the Great Recession that the WLI has been in negative territory. 
Initial unemployment claims decreased from 386,000 (reported last week) to 374,000 this week. Historically, claims exceeding 400,000 per week usually occur when employment gains are less than the workforce growth, resulting in an increasing unemployment rate (background here and here). The real gauge – the 4 week moving average – declined from 386,750 (reported last week) to 385,750. Because of the noise (week-to-week movements from abnormal events AND the backward revisions to previous weeks releases), the 4-week average remains the reliable gauge. 
Data released this week which contained economically intuitive components (forward looking) were
- Rail movements (which was growing this week with or without considering coal transport – but was “less good”);
- BLS jobs report transport employment (yes, this segment is still weakly growing);
- ISM services business activity index (is slightly in contraction – as this index is a little noisy. Wait and see if next month’s data is negative before I would suggest it could be a recession warning).
All other data released this week does not have enough correlation to the economy to be considered intuitive.
Weekly Economic Release Scorecard:
Click here to view the scorecard table below with active hyperlinks.
Bankruptcy this Week: The City of Stockton, California (Chapter 9), GameTech International
