I continually warn about reading too much into the monthly jobs report from the BLS. I continue to say that jobs are a lagging indicator - the data is preliminary and incapable of demonstrating the state and/or trends of the economy in real time.
Follow up:
Usually some reader pipes up saying it confirms the real state of the economy. Horse-feathers [this is not the smelly word I would use].
- First quarter GDP showed a slowing economy.
- Leading indicators have been forecasting a slowing economy since last year.
- Econintersect has been forecasting a slowing economy.
Yet, employment growth trends did not indicate a slowing economy until this month when the backward revisions finally started catching up with the underlying economy.
Unadjusted Non-Farm Private Employment - Year-over-Year Change (blue bars - left axis) and Year-over-Year Growth Acceleration / Deceleration From Previous Month (red line - right axis)
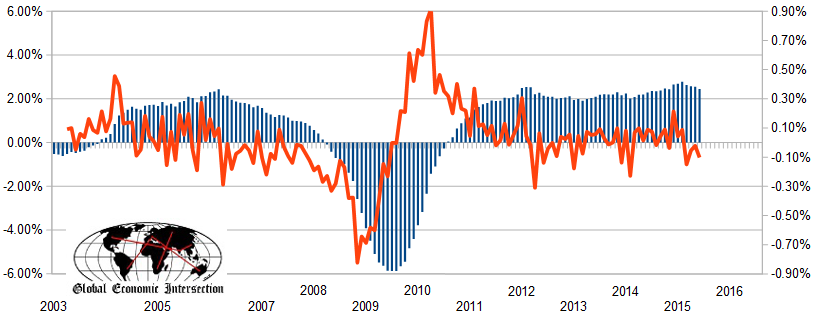
Now, clearly the jobs report is showing a slowing rate of jobs growth beginning in March 2015 - an economic lag of 2 months - and all subject to further revision. Who knows, next year at this time pundits will be writing how accurately the jobs data mirrored the economy as backward revisions finally catch up to economic reality. No one ever seems to use the first released jobs growth numbers when discussing employment history and how it relates to the economy.
The fundamentals which lead jobs growth had been moderately growing during 2014. However, our 6 month forecast (as well as The Conference Board's employment index) is now showing marginal deceleration. Note that the Econintersect Jobs Index is based on economic elements which create jobs, and (explanation here) measures the historical dynamics which lead to the creation of jobs. It measures general factors, but it is not precise (quantitatively) as many specific factors influence the exact timing of hiring. This index should be thought of as a measurement of jobs creation pressures.
Comparing BLS Non-Farm Employment YoY Improvement (blue line, left axis) with Econintersect Employment Index (red line, left axis) and The Conference Board ETI (yellow line, right axis)
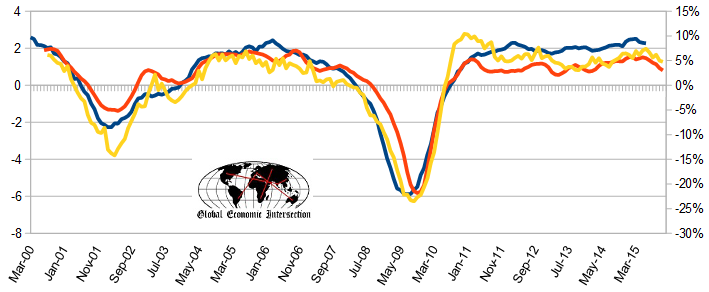
I am not saying that either the economy or employment growth rate will plunge. No identifiable economic component is suggesting this. I worry about unpredictable impacts such as Greece - which could bring unquantifiable negative consequences to the USA and the other major economies which continue to grow at a snails pace.
I will never understand the significance placed on this flawed (in real time) employment report.
Other Economic News this Week:
The Econintersect Economic Index for July 2015 strengthened partially reversing last month's decline. Still, the tracked sectors of the economy remain relatively soft with most expanding at the lower end of the range seen since the end of the Great Recession. Thinking through the reasons for this month's increase, it was the improvement in a few areas from terrible to marginal growth.
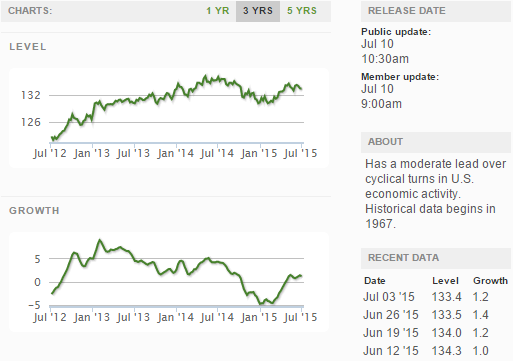
The ECRI WLI growth index is now in positive territory but still indicates the economy will have little growth 6 months from today.
Current ECRI WLI Growth Index
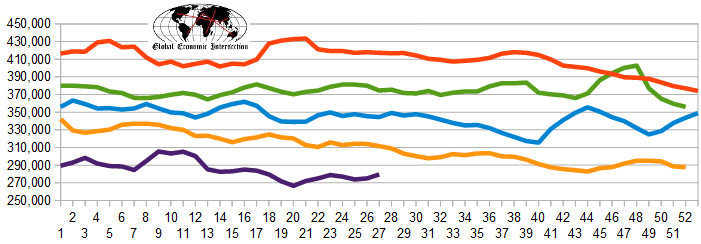
The market was expecting the weekly initial unemployment claims at 260,000 to 290,000 (consensus 276,000) vs the 297,000 reported. The more important (because of the volatility in the weekly reported claims and seasonality errors in adjusting the data) 4 week moving average moved from 275,000 (reported last week as 274,750) to 279,500. The rolling averages generally have been equal to or under 300,000 since August 2014.
Weekly Initial Unemployment Claims - 4 Week Average - Seasonally Adjusted - 2011 (red line), 2012 (green line), 2013 (blue line), 2014 (orange line), 2015 (violet line)
Bankruptcies this Week: London, U.K.-based Afren filed (Chapter 15), F-Squared Investments Inc.
Click here to view the scorecard table below with active hyperlinks
Weekly Economic Release Scorecard:
