A healthy jobs report, a potential Dodd-Frank peel back, and renewed talks of tax cuts propelled markets higher.
Financial futures traders loved Friday's events and they expressed that sentiment by buying into US assets. For the first time in a LONG time, the jobs report was judged by its merit as opposed to the anticipated reaction by the Federal Reserve. In other words, the markets no longer seem to be held hostage by the Fed's every move. Instead, investors are looking to speculative economic growth as the driving factor with the Fed's monetary policy as a secondary concern.
Non-farm payrolls grew by 227,000 in January but the good news was slightly dampened by sluggish wage growth. On a positive note, the unemployment rate ticked higher to 4.8%. No, that isn't a typo...a higher unemployment rate is a positive. The increase in the unemployment rate is a sign that the labor force has increased. In short, some of those who were discouraged from looking for work have found a reason to get back on the job-hunt (remember, the headline unemployment report fails to recognize those who stopped looking for a job out of frustration but are still unemployed).
Treasury Futures Market Analysis
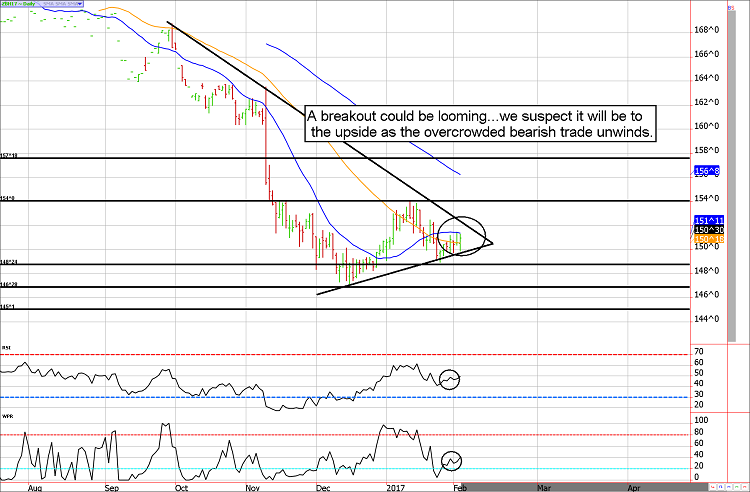
The ZB futures needs to break above 154 to open the barn door
We've been talking about the fact that speculators are currently holding one of the largest net short positions in history in the 10-year note. As we've seen over and over again, when the bus gets too full traders are eventually forced to unwind their positions. Thus, we tend to believe the Treasury market could be in store for a rip your face off type rally. Unfortunately, even if we are right, we have no way of knowing if the move will occur tomorrow or several weeks (or even months) from now.
In the meantime, we'll be looking for a break above resistance in the 30-year bond near 154 (125'21 in the 10-year note). If prices breach these levels, the shorts might think twice about sticking with their bearish trades and the fund could begin.
Treasury Futures Market Analysis
**Bond Futures Market Consensus:** We'll need to see a break above 154'0 in the 30-year bond and 125'21 in the 10-year note to start squeezing the bears out of the market.
**Technical Support:** ZB : 148'24, 146'28 and 145'01 ZN: 123'12, 122'15 and 122'07
**Technical Resistance:** ZB: 154'10, and 157'18 ZN: 125'21, and 127'28
Stock Index Futures Market Analysis
There is a new Sheriff in town, and stock investors like it (for now).
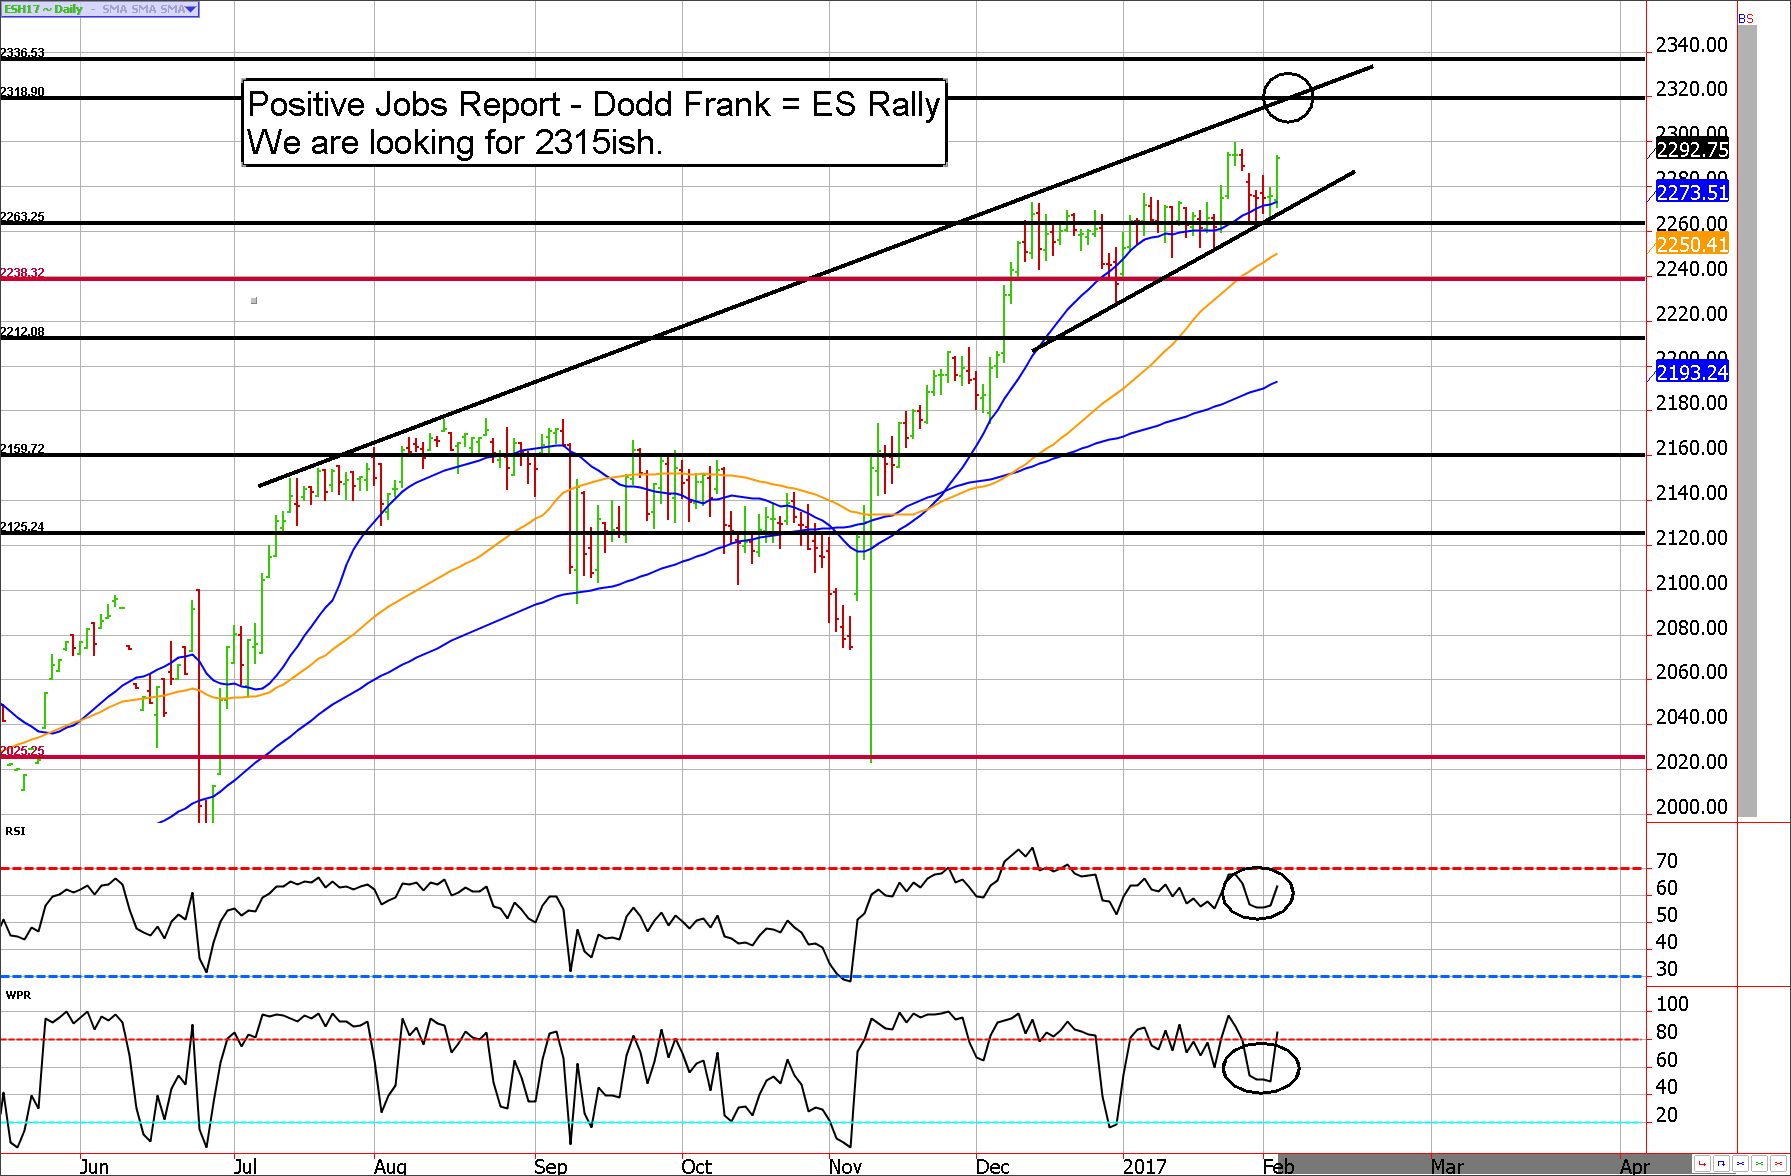
It's been astonishing to watch the price momentum and extreme bullish sentiment in the s&P since the November 8th election. While we acknowledge there is a good chance prices have gotten ahead of reality, we cannot deny the fact that this market is one to be reckoned with. We wouldn't be willing to jump in front of this rally until prices reached the 2315 to 2320 area. At these levels, the odds are in favor of a price correction (which could be temporary, or it could be something much bigger). We will likely be looking for call options to sell against the move should prices reach the target.
From a previous newsletter but still valid:
According to the Stock Trader's Almanac, the month of February is the weak link in the "best six months" for the equity market. Over the last 15 years, the S&P has been up 9 and down 6 but the average change is -0.2%. However, they also note February has been the worst month for the NASDAQ on post-election years with an average loss of 3.9%.
With this in mind, we continue to believe the upside is relatively limited for the time being and any large rally should be an opportunity for the bears to get positioned. We would be willing to turn bearish again on a spike above 2300...preferably 2315ish.
Stock Index Futures Market Ideas
**e-mini S&P Futures Market Consensus:**
We'd like to see a run to 2313, this should act as a high probability reversal area. We'll consider selling calls as the market approaches the noted level.
***We are now charting the March contract!**
**Technical Support:** 2260, 2238, and 2212
**Technical Resistance:** 2301, 2318, and 2336
e-mini S&P Futures Day Trading Ideas
**These are counter-trend entry ideas, the more distant the level the more reliable but the less likely to get filled**
ES Day Trade Sell Levels: Let's see what Monday looks like.
ES Day Trade Buy Levels: Let's see what Monday looks like.
In other commodity futures and options markets....
June 23 - Go long corn futures near 392 using mini contracts (the beginning of a scale trade). Full-sized contracts can be used if available margin and risk tolerance is appropriate.
June 30 - Buy September mini (or full-sized) wheat near $4.47.
July 5 - Add to the long mini corn (or full sized) near $3.45.
July 14 - Sell the corn add-on near 370 to lock in a profit (hold the original entry).
July 29 - Buy mini corn future near $3.33 to average entry cost lower.
July 29 - Buy mini wheat to add to our long and adjust the average position entry to $4.25ish.
August 18 - Sell half of the mini wheat position to lock in a profit of about 20 cents on the add-on contract. We'll hold the original position in hopes of a continued upswing.
October 6 - Buy March euro strangles using the 123 calls and the 100 puts for about $400. This trade is looking for a sharp increase in volatility.
October 27 - Liquidate half of the corn position, which was added near $3.33 to lock in a profit of about 20 cents.
November 14 - Sell March euro 100 put for about 41 ticks to lock in $250 to $300 per contract. We are still holding the long call half of the
strangle, which is under water.
January 6 - Buy March ES 2025 puts for about 7.50 in premium ($375).
January 18 - Sell April live cattle 127 calls near 97.5 ticks ($390).
January 31 - Buy back April live cattle 127 call to lock in quick profit of anywhere from $200 to $250 per contract before transaction costs.
January 31 - Buy back March ES 2345 calls near 4.75 to lock in profit of roughly $200 to $250 per contract before transaction costs.
(Our clients receive short option trading ideas in other markets such as gold, crude oil, corn, soybeans, Euro, Yen, and more. Email us for more information)
Disclaimer: **There is substantial risk of loss in trading futures and options.** These recommendations are a solicitation for entering into derivatives transactions. All known news and events have already been factored into the price of the underlying derivatives discussed. From time to time persons affiliated with Zaner, or its associated companies, may have positions in recommended and other derivatives. Past performance is not indicative of future results. The information and data in this report were obtained from sources considered reliable. Their accuracy or completeness is not guaranteed. Any decision to purchase or sell as a result of the opinions expressed in this report will be the full responsibility of the person authorizing such transaction. Seasonal tendencies are a composite of some of the more consistent commodity futures seasonals that have occurred over the past 15 or more years.
There are usually underlying, fundamental circumstances that occur annually that tend to cause the futures markets to react in a similar directional manner during a certain calendar year. While seasonal trends may potentially impact supply and demand in certain commodities, seasonal aspects of supply and demand have been factored into futures & options market pricing. Even if a seasonal tendency occurs in the future, it may not result in a profitable transaction as fees and the timing of the entry and liquidation may impact on the results. No representation is being made that any account has in the past, or will in the future, achieve profits using these recommendations. No representation is being made that price patterns will recur in the future.
