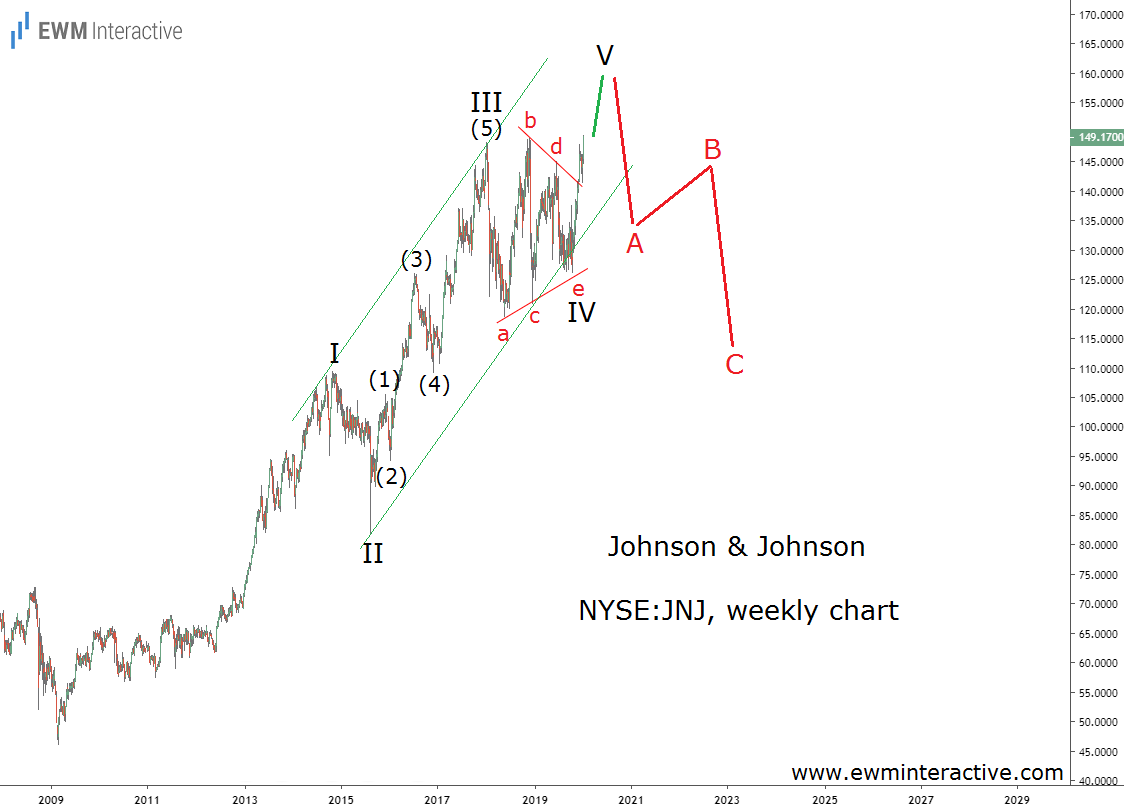
Despite its top quality, Johnson & Johnson didn’t fully participate in the post-2009 bull market. Johnson & Johnson (NYSE:JNJ) stock is up 224% since the bottom of the Financial Crisis, while the Dow Jones added 354% in the same period.
However, JNJ stock climbed to a new all-time high last week in a breakout that makes the bulls very excited about the future. But are they right to feel optimistic? That is the question we hope to answer with the help of the Elliott Wave principle and the chart below.

JNJ’s weekly chart reveals the entire price structure from the 2009 bottom at $46.25. As you can see, it is a textbook five-wave impulse, labeled I-II-III-IV-V. It unfolded within the parallel lines of a trend channel and the sub-waves of wave III are also visible.
The market apparently took the guideline of alternation into account, too. Wave II was a sharp plunge, while wave IV moved sideways in a triangle correction. Triangles precede the final wave of the larger sequence. If this count is correct, the current rally must be wave V.
The theory postulates that a three-wave correction in the other direction follows every impulse. For JNJ stock, this means we can expect a bearish reversal once wave V is over. The anticipated retracement has the potential to erase the entire fifth wave.
A decline back to the support area of wave IV or even lower is very likely. $110 a share seems like a reasonable target in the next couple of years. The risk/reward ratio doesn’t look very favorable to the bulls with the stock around $150.
