
Low-cost carrier, JetBlue Airways Corporation’s (NASDAQ:JBLU) third-quarter 2017 earnings of 55 cents per share beat the Zacks Consensus Estimate by 3 cents. Quarterly earnings, however, declined 5.2% from the year ago figure due to higher costs. The recent hurricanes also hurt results.
Operating revenues came in at $1,813 million, just ahead of the Zacks Consensus Estimate of $1,809.3 million. Revenues increased 4.7% from the year-ago figure. Passenger revenues, which accounted for bulk of the top line (89.5%), improved 3.3% in the third quarter of 2017. Other revenues increased 18.2%.
Operating Statistics
Capacity, measured in available seat miles, expanded 3.7% year over year. Traffic, measured in revenue passenger miles, grew 2.3% in the third quarter. Load factor (percentage of seats filled by passengers) declined 120 basis points (bps) year over year to 85.1% in the reported quarter as traffic growth was outpaced capacity expansion.
Yield per passenger mile improved 1% year over year to 13.32 cents in the reported quarter. While passenger revenue per available seat mile (PRASM: a key measure of unit revenue) declined 0.4% to 11.34 cents, operating revenue per available seat mile (RASM) increased 0.9% to 12.67 cents.
Expenses
In the third quarter, total operating expenses (on a reported basis) increased 9.1% year over year. Average fuel cost per gallon (including fuel taxes) escalated 14.9% to $1.69. Moreover, JetBlue’s operating cost per available seat mile (CASM) increased 5.2% to 10.50 cents in the reported quarter. Excluding fuel, the metric also climbed 2.7% to 8.07 cents on the back of rise in labor costs.
JetBlue Airways Corporation Price, Consensus and EPS Surprise
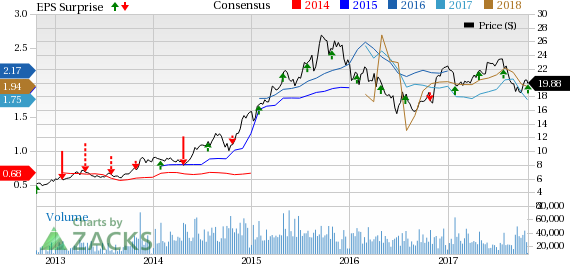
JetBlue Airways Corporation Price, Consensus and EPS Surprise | JetBlue Airways Corporation Quote
Balance Sheet
JetBlue, carrying a Zacks Rank #5 (Strong Sell), exited the quarter with cash and cash equivalents of $394 million compared with $433 million at the end of 2016. Total debt, at the end of the quarter was $1,255 million than $1,384 million at the end of 2016. In fact, the company is constantly working toward reducing its debt levels.
You can see the complete list of today’s Zacks #1 Rank (Strong Buy) stocks here.
Outlook
For the fourth quarter of 2017, the carrier expects capacity to increase between 4.5% and 5.5%. For the full-year 2017 the metric is anticipated to increase in the range of 4% to 5%. Consolidated operating cost per available seat mile, excluding fuel, is expected to grow in the band of 5% to 7% in the final quarter of 2017.
For the full-year 2017 the metric is still projected to grow in the range of 4% to 5%. Operating revenue per available seat mile (RASM) is anticipated to grow in the range of (3%) to 0% on a year-over-year basis.
Other Important Releases Coming Up
Investors interested in the Zacks Airline industry keenly await the third-quarter earnings reports of American Airlines Group Inc. (NASDAQ:AAL) , Alaska Air Group, Inc. (NYSE:ALK) and Norfolk Southern Corp. (NYSE:NSC) . While Alaska Air Group and Norfolk Southern will report third-quarter earnings on Oct 25, American Airlines will reveal the same on Oct 26.
Today's Stocks from Zacks' Hottest Strategies
It's hard to believe, even for us at Zacks. But while the market gained +18.8% from 2016 - Q1 2017, our top stock-picking screens have returned +157.0%, +128.0%, +97.8%, +94.7%, and +90.2% respectively.
And this outperformance has not just been a recent phenomenon. Over the years it has been remarkably consistent. From 2000 - Q1 2017, the composite yearly average gain for these strategies has beaten the market more than 11X over. Maybe even more remarkable is the fact that we're willing to share their latest stocks with you without cost or obligation.
See Them Free>>
JetBlue Airways Corporation (JBLU): Free Stock Analysis Report
American Airlines Group, Inc. (AAL): Free Stock Analysis Report
Alaska Air Group, Inc. (ALK): Free Stock Analysis Report
Norfolk Souther Corporation (NSC): Free Stock Analysis Report
Original post
Zacks Investment Research