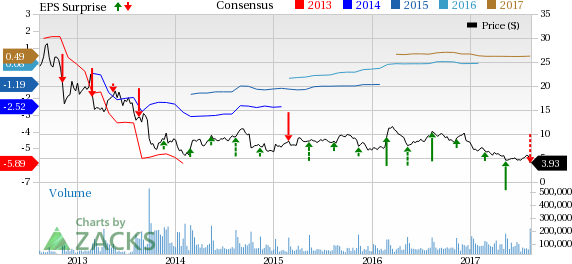
J. C. Penney Company, Inc. (NYSE:JCP) shares tanked 16.6% on Aug 11 as the company failed to impress investors with its quarterly numbers, when it posted second-quarter fiscal 2017 results. In fact, the stock has witnessed a decline of 65.2% in the past one year, wider than the industry’s slump of 39.7%. The company’s bottom-line came in below the Zacks Consensus Estimate after beating the same in the trailing nine quarters. Even its top-line which surpassed the estimate for the first time after missing the same in the preceding five quarters failed to cushion the stock.
Let’s Unveil the Picture
J. C. Penney posted loss per share of 9 cents wider than the Zacks Consensus Estimate of a loss of 6 cents. In the prior-year quarter, the company had reported adjusted loss of 5 cents. Moreover, the company delivered net loss of $62 million or 20 cents on a GAAP basis, wider than the net loss of $56 million or 18 cents reported in the year-ago quarter. Further, it not only reported widening net loss but also dismal comparable sales.
The company’s total net sales of $2,962 million surpassed the Zacks Consensus Estimate of $2,870 million and increased 1.5% year over year, after witnessing a decrease of 3.7% in the preceding quarter. Further, the company witnessed sequential increase in apparel business, driven by substantial improvement in kids’ apparel. However, comparable-store sales (comps) decreased 1.3%, compared with an increase of 2.2% in the prior-year quarter.

Sturdy performance was witnessed across Sephora, Home, Salon and Fine Jewelry divisions. Management remains optimistic about roll out of appliances, new Sephora locations, center core refreshes, in-store.com fulfillment and buy online, pick up in store same day initiative.
Gross profit in the quarter decreased 4.2% to $1,039 million, while gross margin contracted 200 basis points (bps) to 35.1%. J. C. Penney’s adjusted EBITDA improved to $196 million from $233 million in the prior-year quarter, while adjusted EBITDA margin decreased 160 bps to 6.6%.
Strategic Initiatives
In an effort, to achieve sustainable growth J. C. Penney had earlier announced strategic initiatives, wherein it shut down 138 stores and is further planning to close two distribution centers. The company stated that it had already closed 127 stores during second quarter. During the quarter under review, liquidation of inventory from these stores impacted the gross margin by 120 bps. These strategic efforts will not only help the company to align its brick-and-mortar presence but will also help it utilize capital resources in locations where it has ample opportunity.
The closure of stores, which represents nearly 13–14% of the company’s store portfolio, is likely to hurt total annual sales by 5%. Further, EBITDA will come down by less than 2% but most importantly it will not affect net income.
These stores were not only reporting dismal comps in comparison with the remaining store base but were also being operated at higher cost. The company anticipates annual saving of nearly $200 million from the store closure program.
Financial Details
J. C. Penney ended the quarter with cash and cash equivalents of $314 million, long-term debt of $3,836 million and shareholders’ equity of $1,115 million. Merchandise inventory levels decreased 6.8% to $2,777 million.
Moreover, in the reported quarter, the company generated $303 million of free cash flow compared with $69 million in the prior-year quarter. Further, it incurred capital expenditures of $109 million in the quarter, down from $121 million in the year-ago quarter.
2017 Outlook
Management expects comps to be in the range of down 1% to up 1%, while gross margin is projected to expand between 30 bps and 50 bps, up from the previous estimate of 20 bps and 40 bps compared with fiscal 2016. Adjusted earnings per share are estimated to be in the range of 40–65 cents. The Zacks Consensus Estimate for fiscal 2017 is currently pegged at 49 cents.
Moreover, the company anticipates generating free cash flow between $300 million and $400 million in fiscal 2017.
At present, J. C. Penney carries a Zacks Rank #3 (Hold).
Interested in the Retail Space? Check These
Investors interested in the retail space may consider some better-ranked stocks such as The Gap, Inc. (NYSE:GPS) , The Children's Place, Inc. (NASDAQ:PLCE) and Gildan Activewear Inc. (TO:GIL) . These stocks carry a Zacks Rank #2 (Buy). You can see the complete list of today’s Zacks #1 Rank stocks here
Gap delivered an average positive earnings surprise of 6.5% in the trailing four quarters and has a long-term earnings growth rate of 8%.
The Children's Place delivered an average positive earnings surprise of 16.3% in the trailing four quarters and has a long-term earnings growth rate of 9%.
Gildan Activewear delivered an average positive earnings surprise of 5.5% in the trailing four quarters and has a long-term earnings growth rate of 13.5%.
5 Trades Could Profit ""Big-League"" from Trump Policies
If the stocks above spark your interest, wait until you look into companies primed to make substantial gains from Washington's changing course.
Today Zacks reveals 5 tickers that could benefit from new trends like streamlined drug approvals, tariffs, lower taxes, higher interest rates, and spending surges in defense and infrastructure. See these buy recommendations now >>
Gap, Inc. (The) (GPS): Free Stock Analysis Report
Children's Place, Inc. (The) (PLCE): Free Stock Analysis Report
J.C. Penney Company, Inc. Holding Company (JCP): Free Stock Analysis Report
Gildan Activewear, Inc. (GIL): Free Stock Analysis Report
Original post
Zacks Investment Research

