Coffee has magical properties. Many people cannot wake up in the morning without it. Companies that sell it have thrived throughout the US, setting up shops like Starbucks (NASDAQ:SBUX), Pete’s, Green Mountain (NASDAQ:GMCR), and a whole host of local ones. And when the people cannot get it, they get the Java Blues.
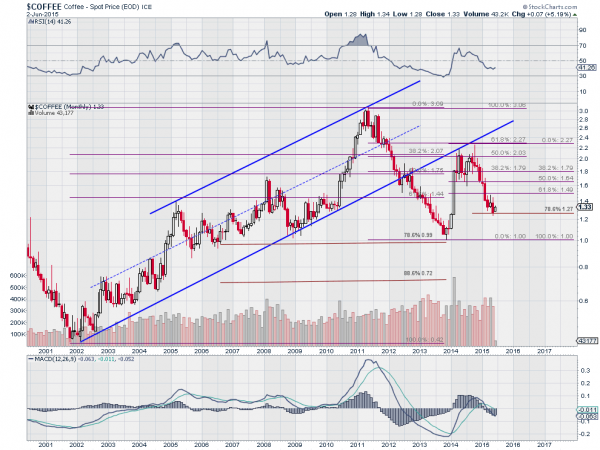
The price of coffee gave many those Java blues for a while too. Coffee prices went on a long trending rise higher from 2002 through to the peak in 2011. This was much like the chart for gold. Liquid gold maybe, and more important to most.

The monthly chart above shows the rise in prices to a double top at 3.08 four years ago. Since then, the price fell back nearly 78.6% before a sharp counter trend bounce into 2014. That bounce retraced 61.8% of the fall before it also reversed. Now, the drop lower has retraced 78.6% of the bounce higher.
A series of nested Fibonacci levels. Some similarities with the same 78.6% retracement. Time for another flip back higher? The rest of the chart suggest not. Looking at the RSI, it is leveling but not turned back higher. It has also not reached oversold levels yet. More importantly, the MACD at the bottom is still heading lower. At the last bottom, it had already stopped falling and started higher at the 78.6% retracement.
There are no signs of that happening soon here. These factors combine to suggest that there is more downside to come for coffee prices. That should keep prices lower at you local shop, or at least keep them from increasing. Maybe that will help keep away the Java Blues.
Disclaimer: The information in this blog post represents my own opinions and does not contain a recommendation for any particular security or investment. I or my affiliates may hold positions or other interests in securities mentioned in the Blog, please see my Disclaimer page for my full disclaimer.
