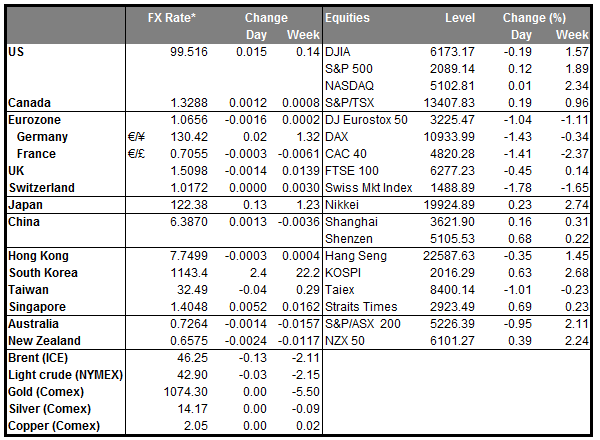
• Japanese November data keep BoJ pressured The latest batch of November data from Japan showed mixed results regarding the outlook of the economy. Core inflation accelerated, beating the forecast of a flat reading and entered the positive territory for the first time in 5 months. However, the unemployment rate edged up and retail sales as well as household spending fell by more than expected. The mixed results could keep the nation’s Central Bank under pressure to expand its stimulus program in the foreseeable future. On the one hand, the rise in the core inflation rate supports the Bank’s view of an improving underlying trend of inflation, especially as the downward pressure from falling oil prices diminishes. On the other hand, the worse-than-expected unemployment rate, retail sales and household spending readings undermine the BoJ’s view that robust domestic consumption will put upward pressure on inflation to help it reach the 2% target. The weak performance of household spending was partially attributed on unusually warm weather, which hurt the sales of clothing in November, as Economics Minister Akira Amari noted. Following the BoJ’s launch of additional measures to stimulate wage growth and inflation at their latest meeting, the soft performance of the indicators may encourage Bank officials to take further action even at their next meeting. As a result, we could see USD/JPY trade higher in the coming month.
• Today: We only get the US Dallas Fed manufacturing activity index for December, but no forecast is available. In any case, this is usually not a major market mover.
• As for the rest of the week, we have a very light calendar week with no major releases on the schedule. The only indicators worthy of note will be released on Wednesday and Thursday.
• On Wednesday, Eurozone’s M3 money supply growth for November is coming out. The M3 growth rate is expected to have remained unchanged, while the 3-month moving average is expected to have increased. This is usually not a major market mover, and thus the reaction in EUR could be muted.
• On Thursday, the US initial jobless claims for the week ended December 25th are expected to have decreased. The 4-week moving average is expected to have decreased as well, which in the absence of any other market moving events, could support the dollar, at least temporarily.
• Finally, Friday is New Year’s Day and as a result the calendar is relatively empty.
The Market
EUR/USD looks ready to challenge 1.0985 again
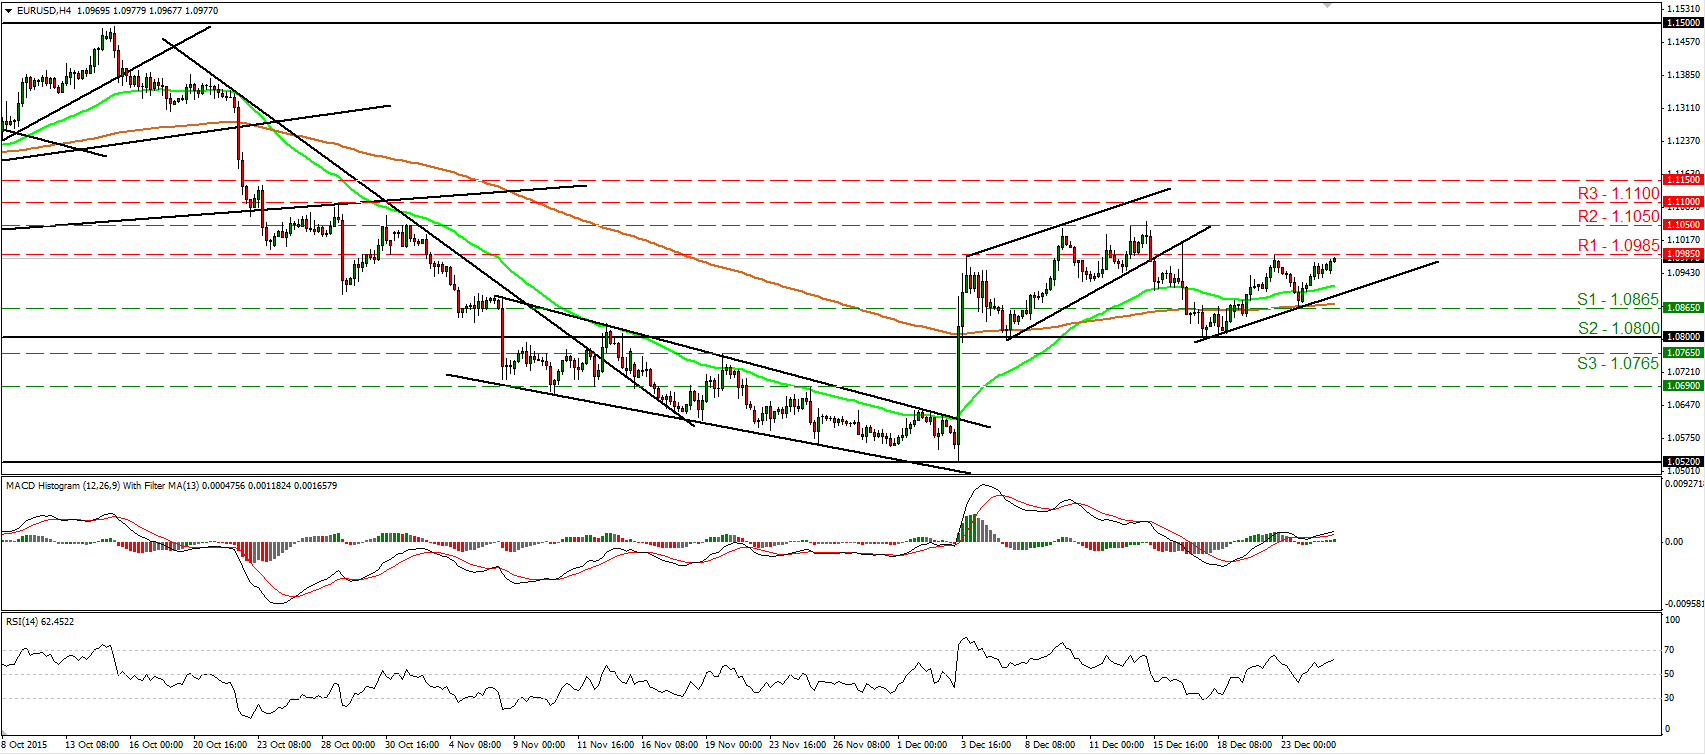
• EUR/USD rebounded from 1.0865 (S1) on Wednesday and continued to trade higher on Thursday. Today during the early European morning, the pair looks to be headed for another test at the 1.0985 (R1) resistance hurdle, where a clear break would confirm a forthcoming higher high on the 4-hour chart and could set the stage for extensions towards our next obstacle area of 1.1050 (R2). Both our short-term oscillators reveal upside momentum and support that EUR/USD could continue trading higher for a while. The RSI stands above its 50 line and points up, while the MACD lies above both its zero and trigger lines, pointing north as well. Switching to the daily chart, I see that on the 7th and 17th of December, the rate rebounded from the 1.0800 (S2) key hurdle, which is also the lower bound of the range it had been trading from the last days of April until the 6th of November. As a result, although I believe EUR/USD is likely to continue higher in the short run, I prefer to maintain my neutral stance as far as the overall outlook is concerned.
• Support: 1.0865 (S1), 1.0800 (S2), 1.0765 (S3)
• Resistance: 1.0985 (R1), 1.1050 (R2), 1.1100 (R3)
GBP/USD breaks back above 1.4900
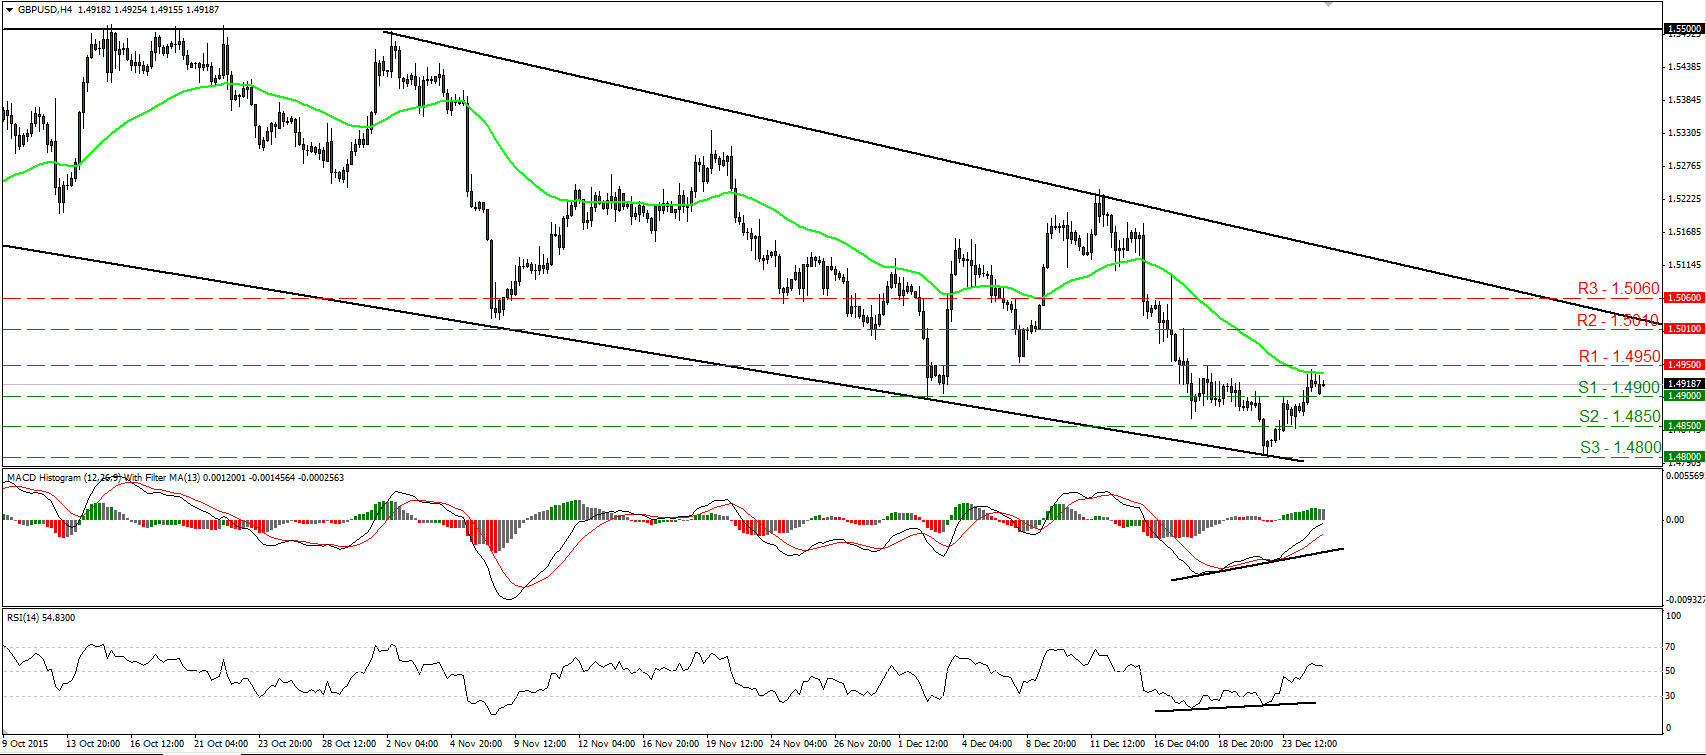
• GBP/USD continued trading higher on Thursday, breaking back above the 1.4900 (S1) line. However, the advance was stopped near the 1.4950 (R1) barrier and then the pair retreated somewhat. A break above the 1.4950 (R1) line is likely to confirm a forthcoming higher high on the 4-hour chart and is possible to pull the trigger for the next resistance obstacle of 1.5010 (R2). Our short-term momentum studies detect upside speed and support somewhat the case. The RSI stands above its 50 line, while the MACD, already above its trigger line, is pointing up and is approaching its zero line. It could turn positive soon. Nevertheless, the fact that the RSI has turned flat raises concerns that a retreat could be looming before the next positive leg. In the bigger picture, the price structure remains lower peaks and lower troughs below the 80-day exponential moving average, which has turned down. Thus, I still see a negative longer-term picture and I would treat the recovery from near 1.4800 (S3) as a corrective phase for now.
• Support: 1.4900 (S1), 1.4850 (S2), 1.4800 (S3)
• Resistance: 1.4950 (R1), 1.5010 (R2), 1.5060 (R3)
USD/JPY hits resistance at 120.55
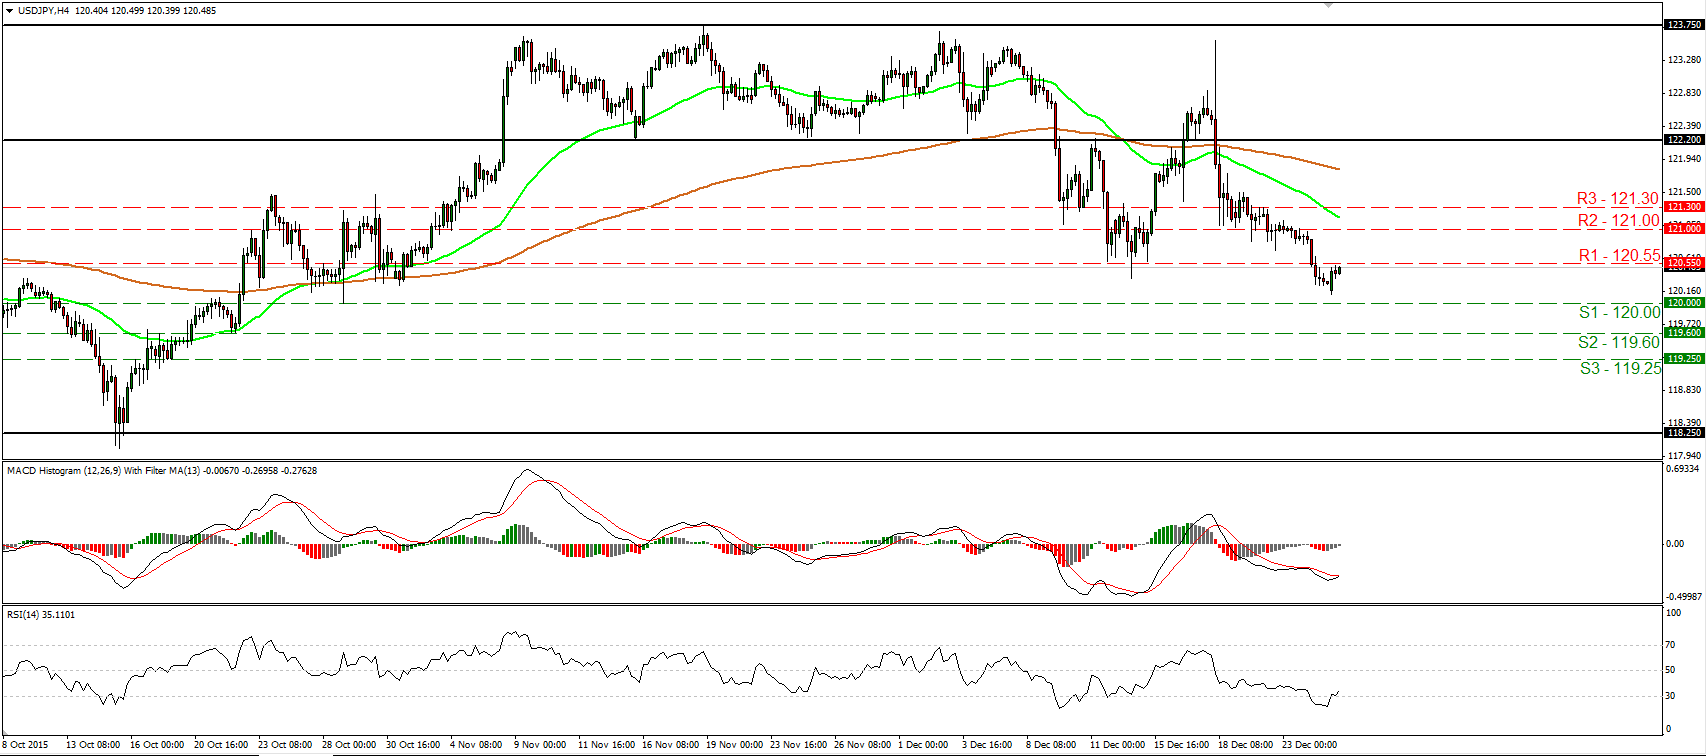
• USD/JPY traded higher on Thursday, but the advance was stopped by the 120.55 (R1) resistance territory. The short-term outlook remains negative in my view and therefore I would expect the bears to regain their momentum at some point and perhaps target the psychological zone of 120.00 (S1). A dip below that zone is likely to extend the short-term downtrend and perhaps aim for the 119.60 (S2) support line. Bearing in mind our oscillators though, I see signs that the upside corrective move may continue for a while, perhaps towards the 121.00 (R2) area. The RSI has bottomed within its oversold territory and just crossed above 30, while the MACD has bottomed and looks ready to move above its trigger line. As for the broader trend, the break below the 122.20 resistance zone, the lower boundary of the sideways range the pair has been trading since the 6th of November, has turned the medium-term picture to the downside in my view.
• Support: 120.00 (S1), 119.60 (S2), 119.25 (S3)
• Resistance: 120.55 (R1), 121.00 (R2), 121.30 (R3)
Gold continues in a consolidative manner
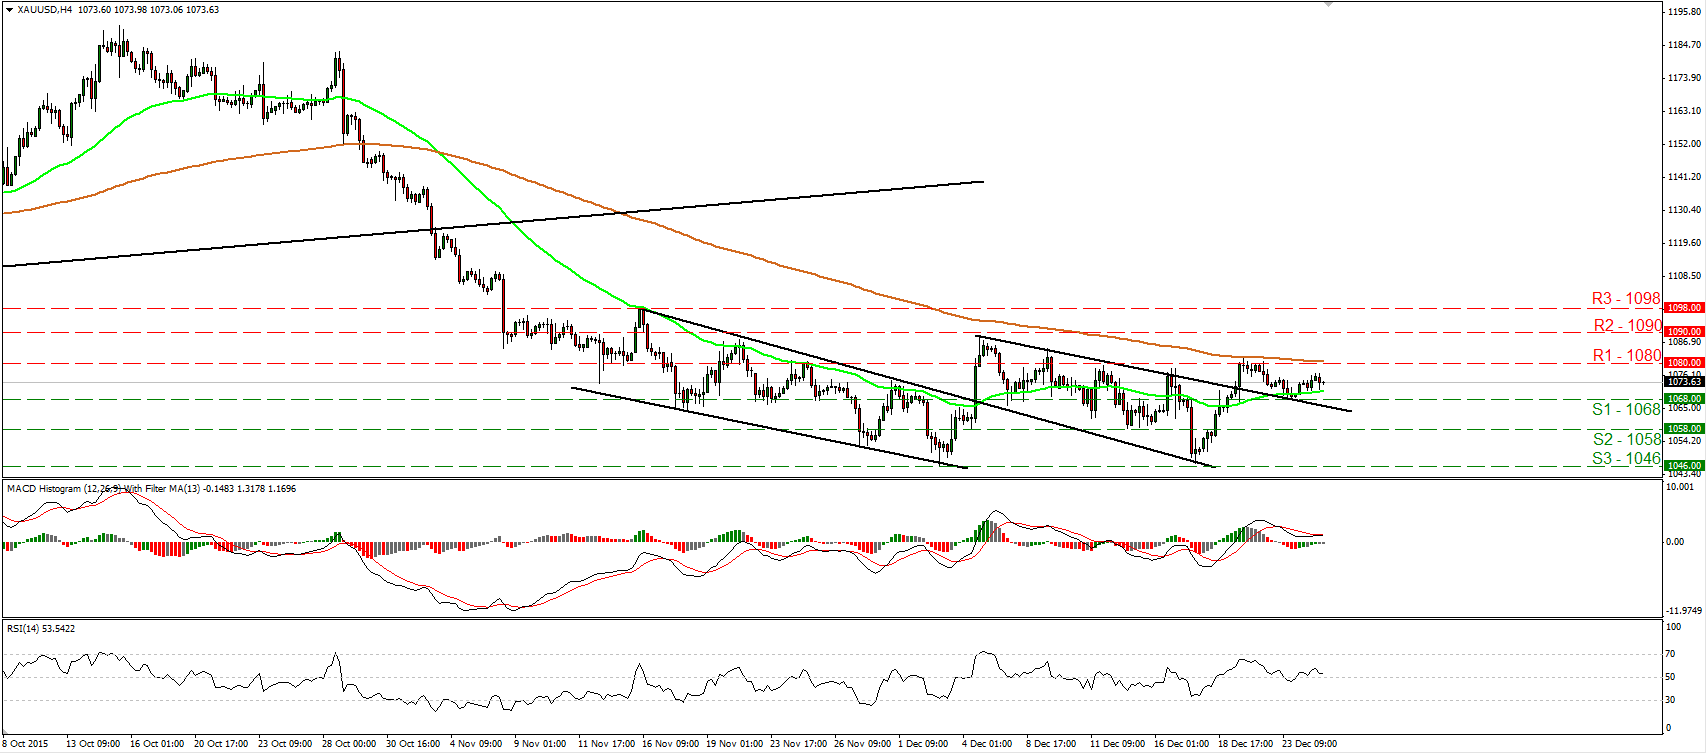
• Gold continued trading in a consolidative manner, staying between the support level of 1068 (S1) and the 1080 (R1) resistance zone. The fact that the metal is trading above the prior downtrend line, drawn from the peak of the 4th of December, keeps the short-term picture somewhat positive for now. A break above 1080 (R1) is needed though to confirm a forthcoming higher high. Something like that could aim for the 1090 (R2) area. Our short-term oscillators give evidence that a minor setback could be on the cards before and if the bulls decide to take control again. The RSI turned down and could fall back below its 50 line soon, while the MACD, although positive, stands fractionally below its trigger line and shows signs that it could also turn south. As for the broader trend, a decisive close above 1090 (R2) is likely to signal the completion of a double bottom formation on the daily chart and could turn the medium-term outlook to the upside. For now, I stay flat and I prefer to wait for the aforementioned break to trust further longer-term advances.
• Support: 1068 (S1), 1058 (S2), 1046 (S3)
• Resistance: 1080 (R1), 1090 (R2), 1098 (R3)
WTI breaks above a short-term downtrend line
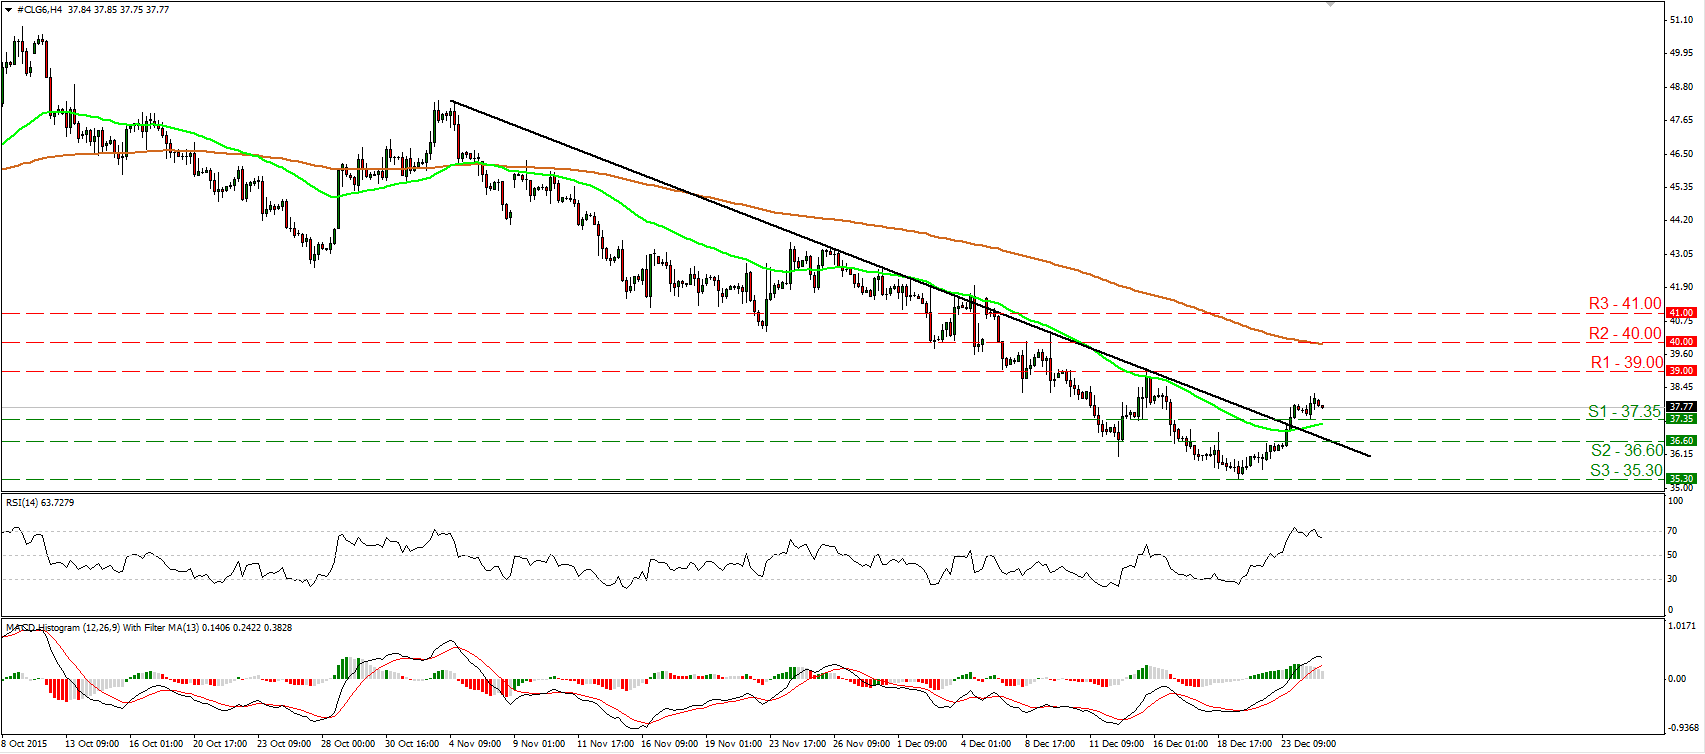
• WTI broke above a short-term downtrend line on Wednesday, and on Thursday it traded in a quiet mode staying above the 37.35 (S1) support line. As long as the price is trading above the aforementioned downtrend line, I see a cautiously positive near-term picture. However, looking at our momentum indicators, I see signs that a negative corrective move could be looming before buyers decide to take the reins again. The RSI has exited its above-70 zone, while the MACD, although positive, has topped and could move below its trigger line soon. A dip back below 37.35 (S1) is likely to confirm the notion and could aim for the next support at 36.60 (S2). On the daily chart, I see that WTI has been printing lower peaks and lower troughs since the 9th of October. As a result, I would consider the longer-term picture to stay negative and I would treat the recovery from 35.30 (S3), or any extensions of it, as a retracement of that negative medium-term downtrend.
• Support: 37.35 (S1), 36.60 (S2), 35.30 (S3)
• Resistance: 39.00 (R1), 40.00 (R2), 41.00 (R3)


