With a relatively light economic calendar for the Monday session, most of the action during the day will almost undoubtedly be of a technical nature. Because of this, there are only a few economic announcements that we are paying attention to, but will be painted more attention to the actual chart setups.
The Asian session starts out with Japanese Consumer Confidence Index numbers, which isn’t exactly a barnburner. However, expect reactions in the Nikkei, and perhaps the USD/JPY pair in reaction to this number if it is a bit of an explosive and positive number. With that, we expect that the market will more than likely ignore this announcement overall.
The Canadian Housing Starts numbers come out, and that in our opinion will be directly influential to the USD/CAD pair. The 1.10 level has recently been very resistive, and if we can get above there we believe that this market can continue to go higher. Beyond that, do not expect too much in the way of reaction.
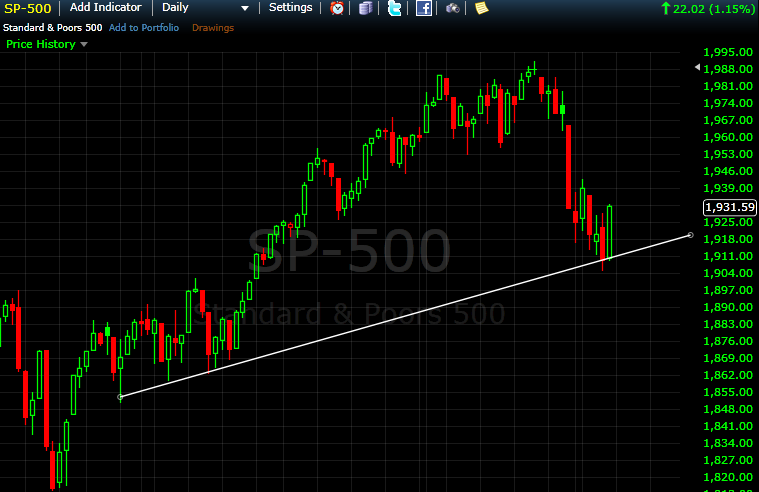
Truthfully, we believe that the S&P 500 is probably one of the more interesting markets as we bounced off of a major trend line during the Friday session. The fact that we have such a bullish candle does in fact suggest that perhaps we will continue to go higher. A move above the 1940 level would be confirmation of continue bullish pressure, and a move back to the 1990 level eventually, as we would press up against the 2000 level in a bid to break out to the upside. That is a longer-term call, but quite frankly above 1940, we believe that buying dips will continue to be the way to go going forward. Even if we get a little bit of pullback during the session on Monday, we would anticipate supportive looking candles on short-term charts as buying opportunities as well.

The EUR/USD pair looks a bit suspect at the moment as well, as we slammed into the 1.3450 level on Friday, which is the beginning of resistance. We believe that the 1.35 level as the actual resistance it needs to be broken above in order to make this a longer-term buy-and-hold type of situation, and do not expect to see that happen. Any type of resistive candle in this region on our charts will have a selling this market over and over again before we reach the actual support level that we think matters – the 1.33 level.
