Who is Kevin Hassett? Wolfe looks at the Trump ally tipped to become Fed Chair.
Note from dshort: On Monday I posted an update on US Treasury yields, several of which hit historic closing lows. The 10-year had tied its historic low at 1.47. How low can the 10-year go? Yesterday morning I updated my data for Japan through Monday's close, my first update since June 4th. At that time, seven weeks ago, the yield on Japan's 10-year bond was 0.84. Monday the 10-year closed at 0.73.
Here is a look at the Nikkei 225 which gives an overview of the cyclical rallies and their duration during Japan's secular bear market, now well into its 22nd year.
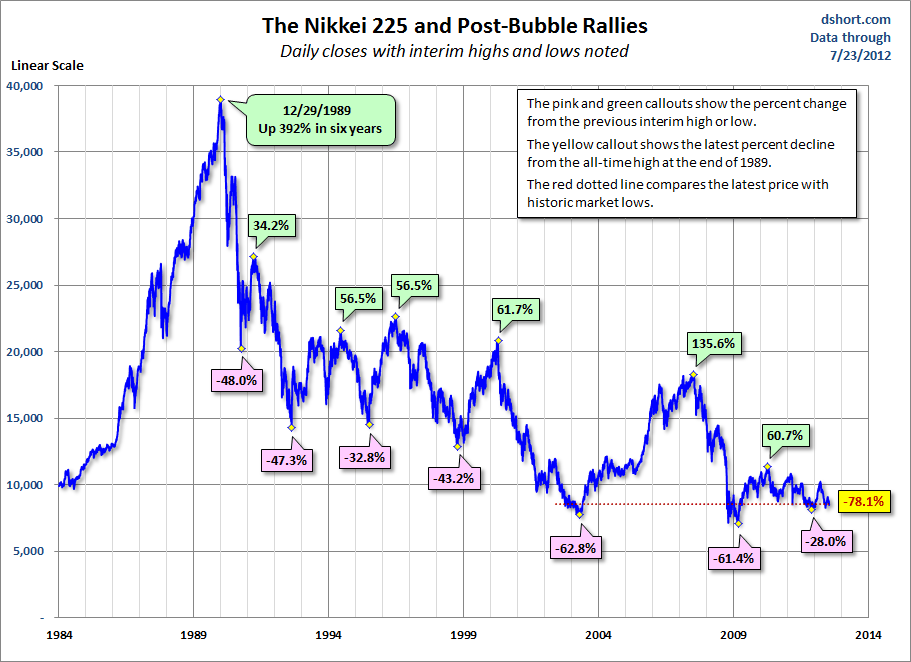
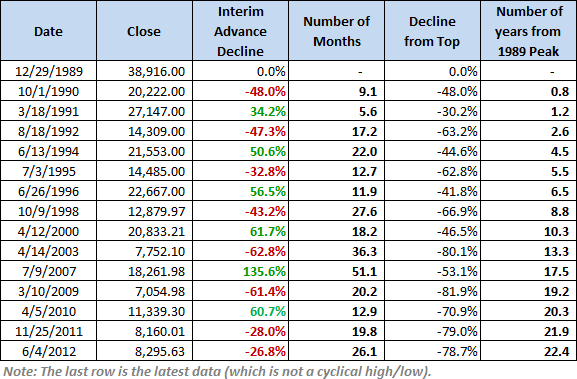
The table below documents the advances and declines and the elapsed time for the major cycles in the Nikkei.
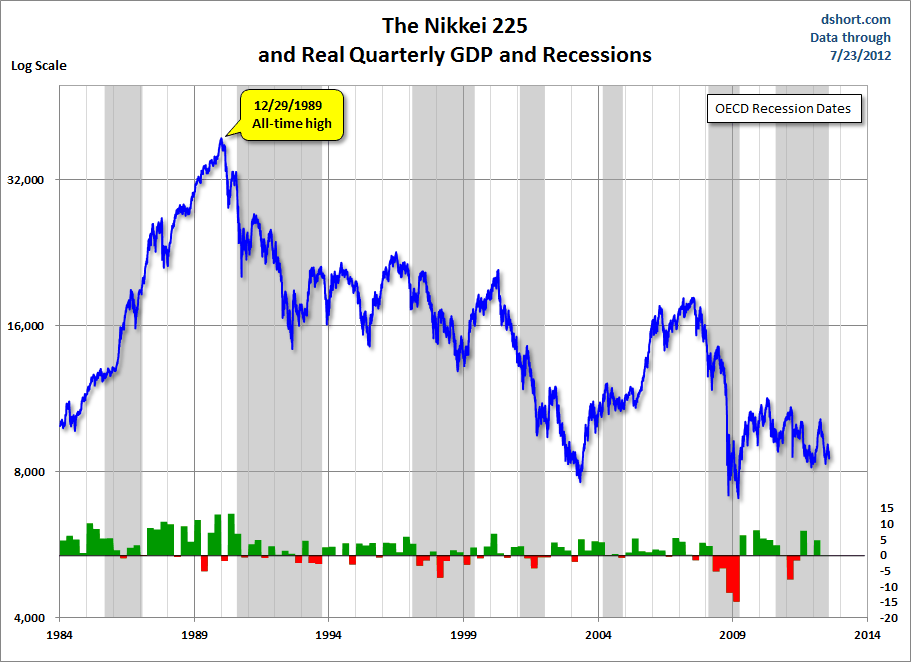
Japan's Q1 Annualized Real GDP 4.7%
The latest Real GDP from Japan is through Q1, which came in at a 4.7% compounded annual rate of change, a sharp rebound from 0.1% revised Q4 GDP. Japan's GDP has been oscillating since the devastating quake and tsunami of Q1 2011.
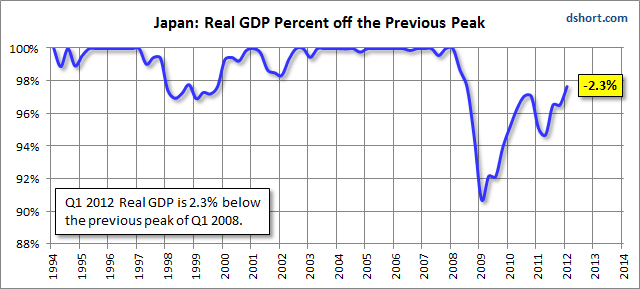
Here is a revealing snapshot of real GDP showing the percent off the most recent peak across time. The underlying calculation is to show peaks at 100% on the left axis. The callout shows the percent off as of the most recent GDP release.
Japanese Bond Yields: How Low Can They Go?
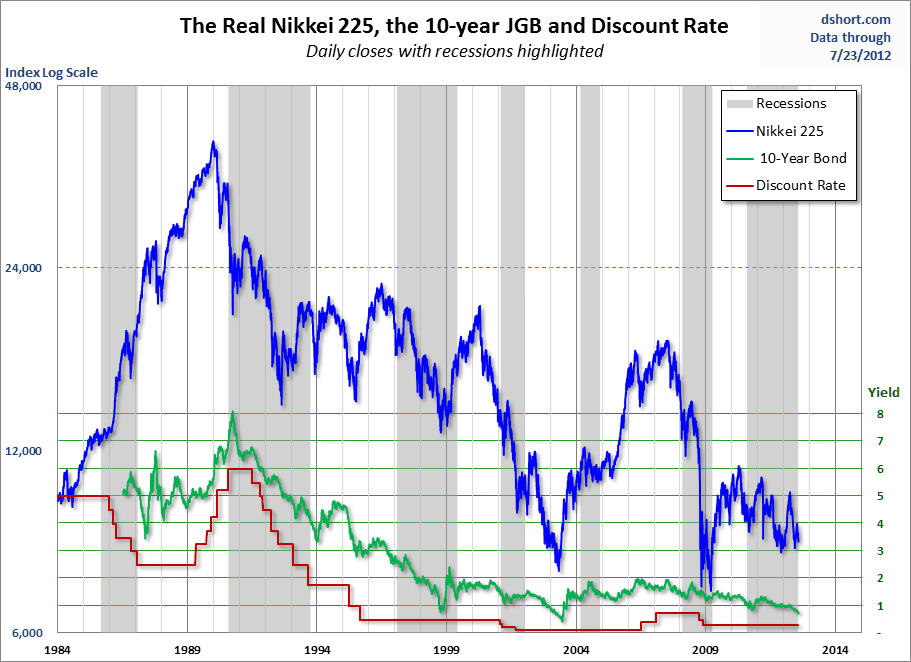
Government bond yields in the safe-haven countries have been plunging of late. The lesson from Japan is that the trend toward lower yields can last a very long time. Here is an overlay of the Nikkei and the 10-year bond along with Japan's official discount rate.
And here is a closer look at the 10-year yield over time.
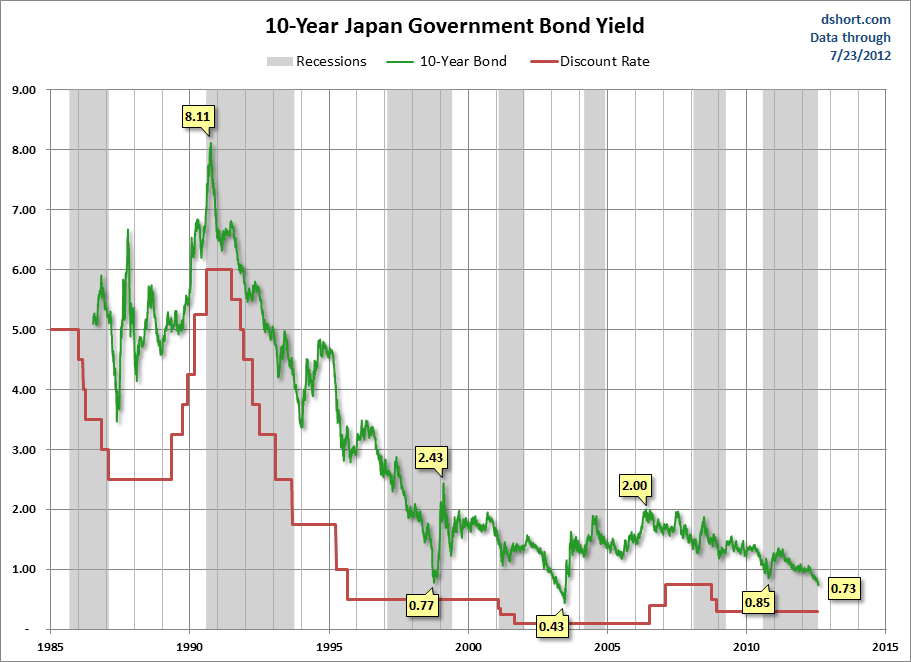
Note: The "recessions" highlighted in the third chart above are based on the OECD Composite Leading Indicators Reference Turning Points and Component Series. I use the peak-to-trough version of data (peak month begins the gray, trough month is excluded), which is conveniently available in the FRED repository. As we can readily see, the OECD concept of turning points is much broader than the method used by the NBER to define recessions in the US.
Here is a look at the Nikkei 225 which gives an overview of the cyclical rallies and their duration during Japan's secular bear market, now well into its 22nd year.

The table below documents the advances and declines and the elapsed time for the major cycles in the Nikkei.

Japan's Q1 Annualized Real GDP 4.7%
The latest Real GDP from Japan is through Q1, which came in at a 4.7% compounded annual rate of change, a sharp rebound from 0.1% revised Q4 GDP. Japan's GDP has been oscillating since the devastating quake and tsunami of Q1 2011.

Here is a revealing snapshot of real GDP showing the percent off the most recent peak across time. The underlying calculation is to show peaks at 100% on the left axis. The callout shows the percent off as of the most recent GDP release.

Japanese Bond Yields: How Low Can They Go?
Government bond yields in the safe-haven countries have been plunging of late. The lesson from Japan is that the trend toward lower yields can last a very long time. Here is an overlay of the Nikkei and the 10-year bond along with Japan's official discount rate.

And here is a closer look at the 10-year yield over time.

Note: The "recessions" highlighted in the third chart above are based on the OECD Composite Leading Indicators Reference Turning Points and Component Series. I use the peak-to-trough version of data (peak month begins the gray, trough month is excluded), which is conveniently available in the FRED repository. As we can readily see, the OECD concept of turning points is much broader than the method used by the NBER to define recessions in the US.
