Note from dshort: Japan's Nikkei 225 has been on a tear of late and is now up 54.8% from its interim low in November of 2011. Earlier today Kyle Bass of Hayman Capital Management was interviewed on CNBC regarding the Bank of Japan's unprecedented monetary policy. The policy is driven by a target of 2% inflation. That's a year-over-year rate that the nation has not experienced for more than four consecutive months since 1991.
Here's a quick review of the Nikkei 225, the 10-year bond and inflation over the past few decades.
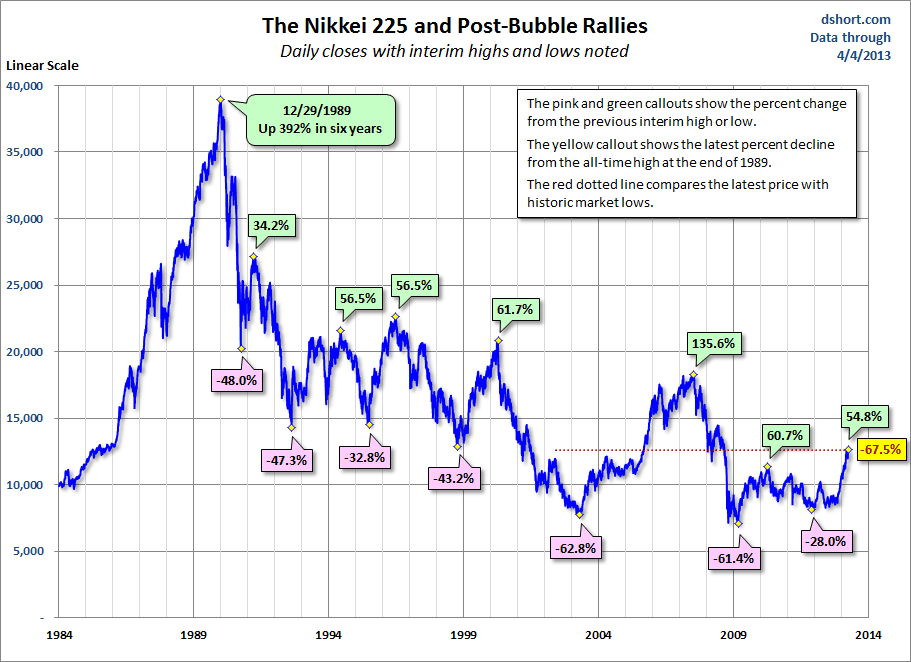
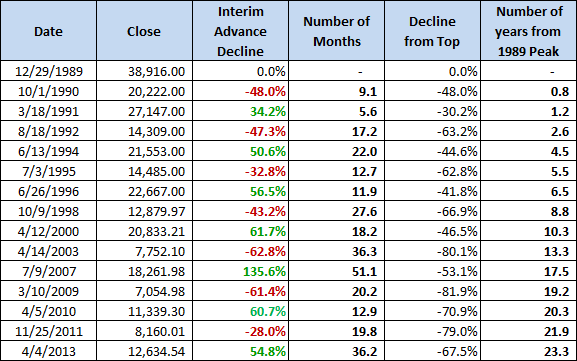
The table below documents the advances and declines and the elapsed time for the major cycles in the Nikkei.
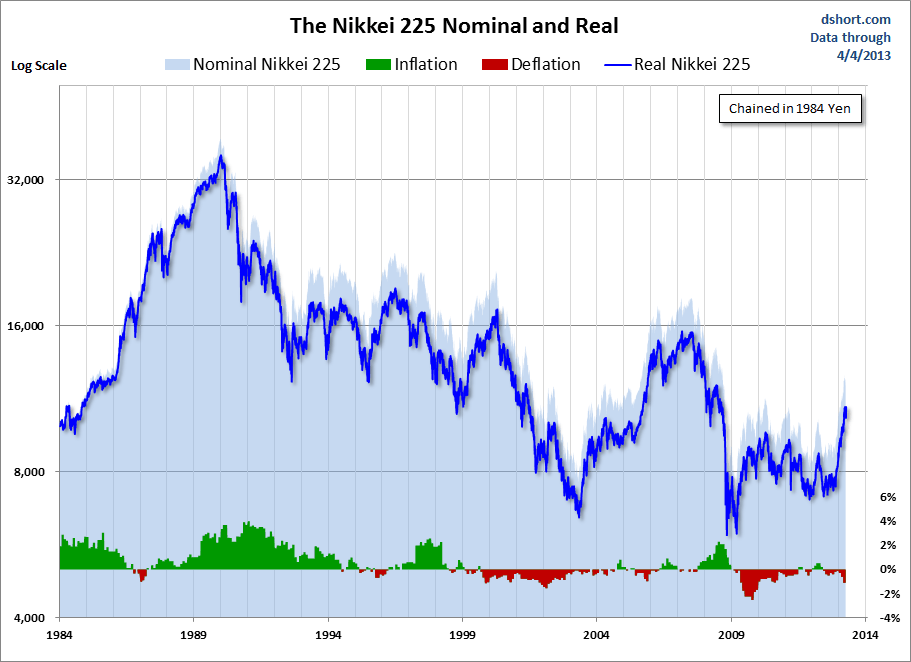
The Nominal versus Real Nikkei 225
For most major indexes, we expect to see a significant difference between the nominal and real price over a multi-decade timeframe. But Japan's chronic bouts of deflation have kept the two metrics rather tight. Note that I've used a log vertical axis for the index price to better illustrate the relative price changes over time.
Japanese Bond Yields: How Low Can They Go?
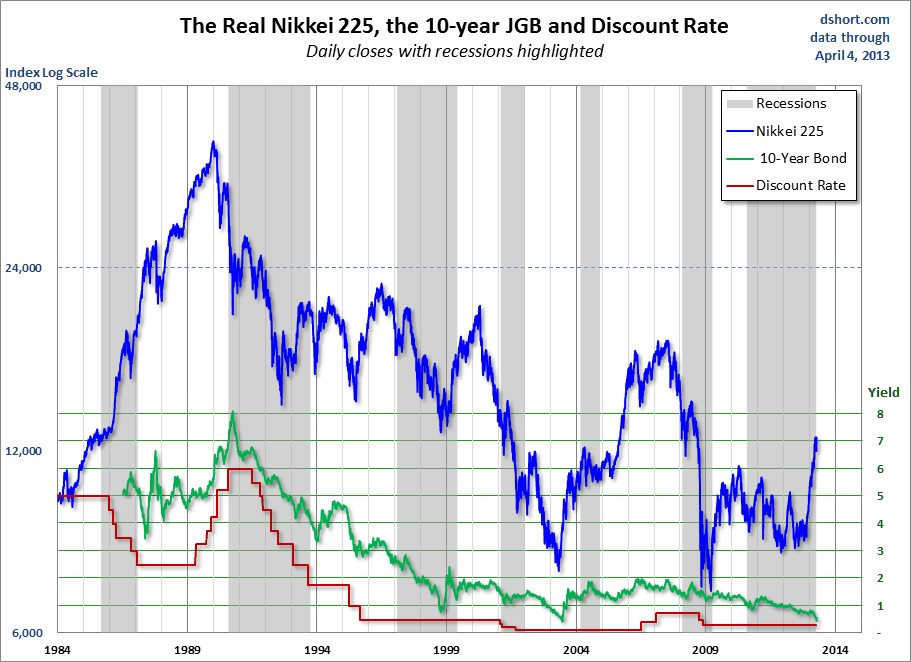
Government bond yields in many safe-haven countries have plunged since the Financial Crisis, although the US 10-year, now hovering around 1.8 percent, is off its historic closing low of 1.43 percent set in July of last year. The lesson from Japan is that the trend toward lower yields can last a very long time. Here is an overlay of the nominal Nikkei (linear scale) and the 10-year bond along with Japan's official discount rate. The index is 42.7% higher at the latest close, but the bond yield is essentially the same.
And here is a closer look at the 10-year yield over time.
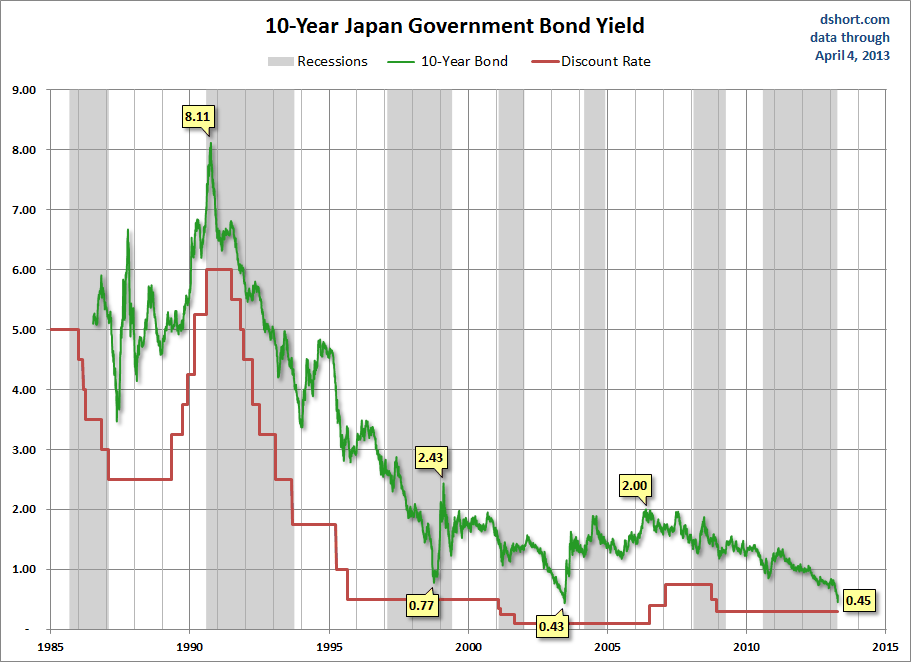
The rally in the Nikkei has been impressive, but note that is has been accompanied by a flight to bonds. The 10-year yield closed today at 0.45 percent. That's two basis points above its all-time closing low set nearly ten years ago on June 12th of 2003. The Nikkei closed that day at 11,144.84.
Note: The "recessions" highlighted in the third chart above are based on the OECD Composite Leading Indicators Reference Turning Points and Component Series. I use the peak-to-trough version of data (peak month begins the gray, trough month is excluded), which is conveniently available in the FRED repository. As we can readily see, the OECD concept of turning points is much broader than the method used by the NBER to define recessions in the US.
Here's a quick review of the Nikkei 225, the 10-year bond and inflation over the past few decades.

The table below documents the advances and declines and the elapsed time for the major cycles in the Nikkei.

The Nominal versus Real Nikkei 225
For most major indexes, we expect to see a significant difference between the nominal and real price over a multi-decade timeframe. But Japan's chronic bouts of deflation have kept the two metrics rather tight. Note that I've used a log vertical axis for the index price to better illustrate the relative price changes over time.

Japanese Bond Yields: How Low Can They Go?
Government bond yields in many safe-haven countries have plunged since the Financial Crisis, although the US 10-year, now hovering around 1.8 percent, is off its historic closing low of 1.43 percent set in July of last year. The lesson from Japan is that the trend toward lower yields can last a very long time. Here is an overlay of the nominal Nikkei (linear scale) and the 10-year bond along with Japan's official discount rate. The index is 42.7% higher at the latest close, but the bond yield is essentially the same.

And here is a closer look at the 10-year yield over time.

The rally in the Nikkei has been impressive, but note that is has been accompanied by a flight to bonds. The 10-year yield closed today at 0.45 percent. That's two basis points above its all-time closing low set nearly ten years ago on June 12th of 2003. The Nikkei closed that day at 11,144.84.
Note: The "recessions" highlighted in the third chart above are based on the OECD Composite Leading Indicators Reference Turning Points and Component Series. I use the peak-to-trough version of data (peak month begins the gray, trough month is excluded), which is conveniently available in the FRED repository. As we can readily see, the OECD concept of turning points is much broader than the method used by the NBER to define recessions in the US.
