
EUR/USD - European Session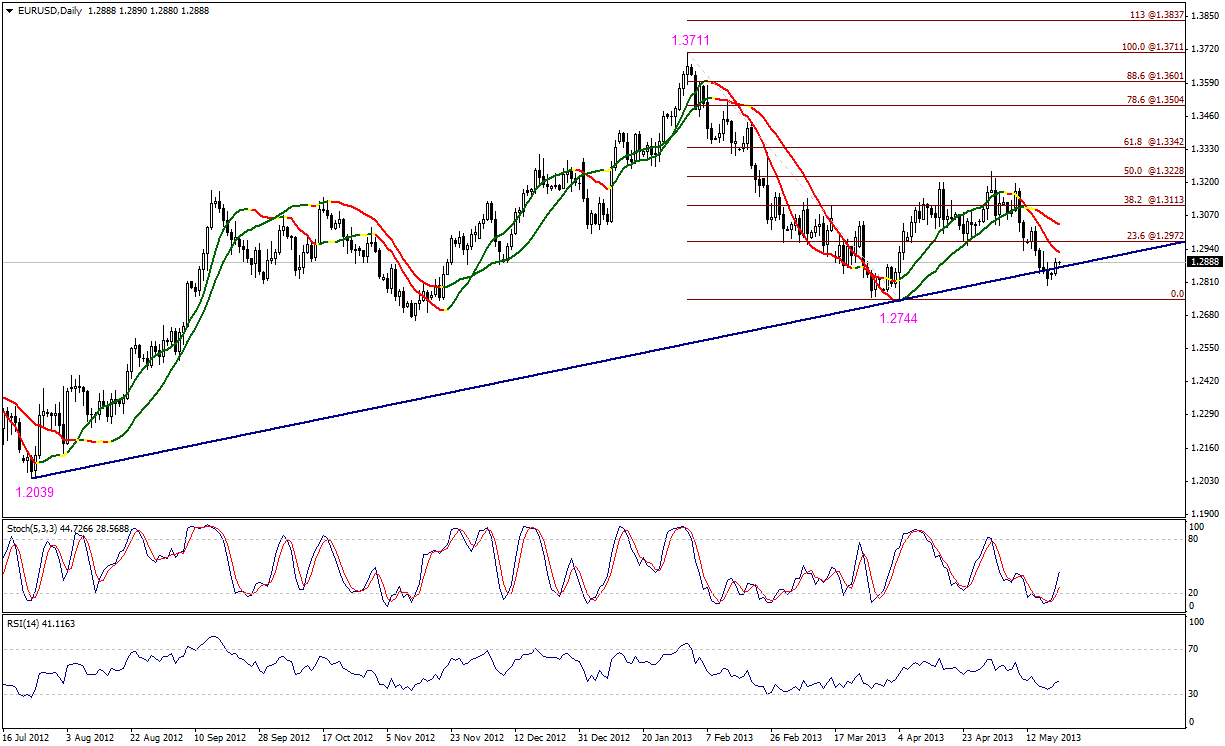 EUR/USD" title="EUR/USD" width="1225" height="746">
The pair moved to the upside yesterday, and is trading above key support of the ascending wave as Stochastic offers positive bias. Linear Regression Indicators are negative and the pair is stable below 1.2970. The negative catalysts conflict with yesterday's move. We prefer to remain neutral today, as we need more confirmations considering the referred to technical contradiction.
The trading range for today is among the key support at 1.3035, and key resistance at 1.3230.
The general trend over short term basis is to the downside, targeting 1.2560 as far as areas of 1.3270 remains intact. EUR/USD_S&R" title="EUR/USD_S&R" width="630" height="116">
GBP/USD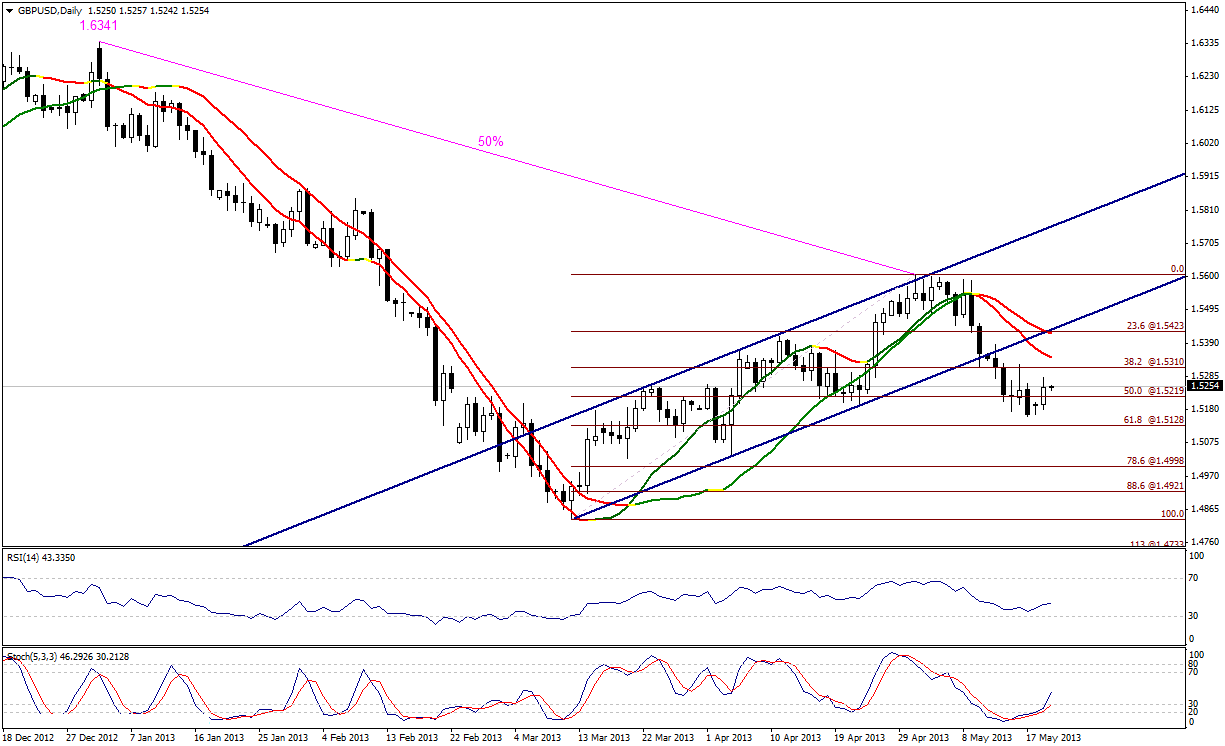 GBP/USD" title="GBP/USD" width="1225" height="746">
The pair moved to the upside yesterda,y and consolidated above 1.5220 weakening and delaying negativity without cancelling it. Linear Regression Indicators are still negativ,e keeping the possibility of bearishness valid. Nevertheless, we prefer to remain neutral for now as we need to see how the pair would react with positive momentum on Stochastic. Trading again below 1.5220 brings back negativity.
The trading range for this week is among key support at 1.5100, and key resistance at 1.5385.
The general trend over short term basis is to the downside, as far as areas of 1.5770 remains intact targeting 1.4355. GBP/USD_S&R" title="GBP/USD_S&R" width="634" height="99">
USD/JPY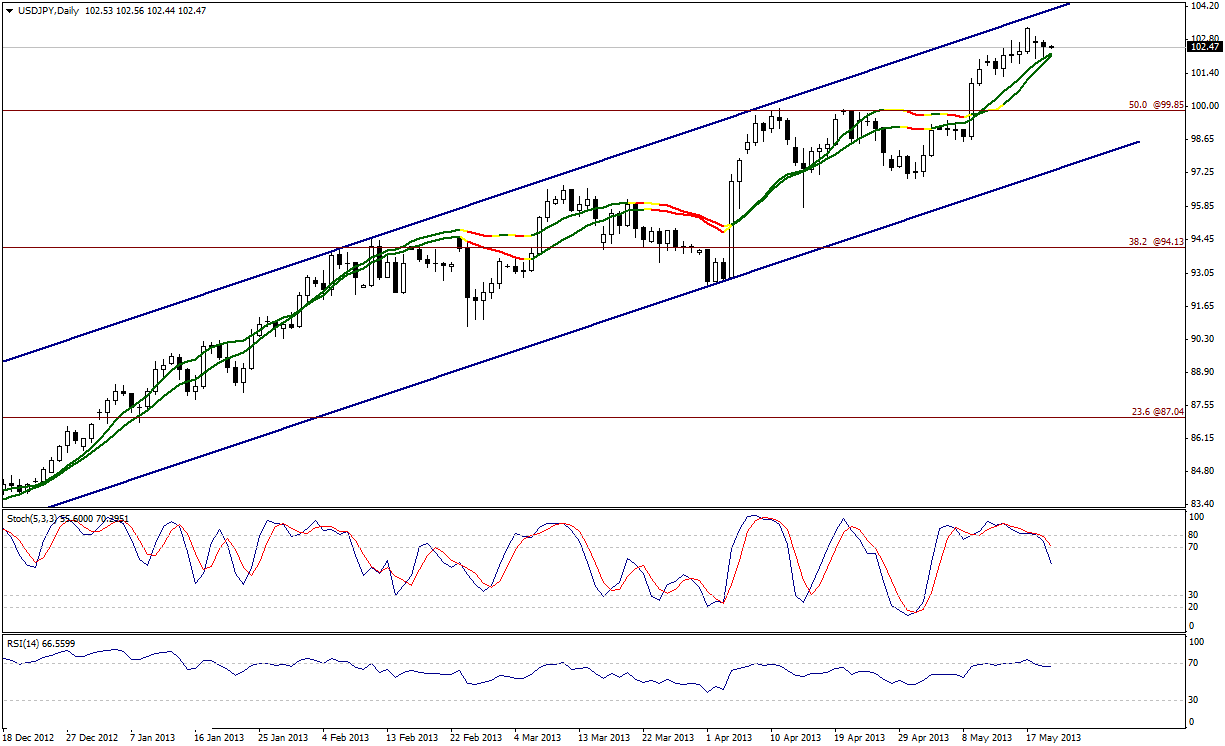 USD/JPY" title="USD/JPY" width="1225" height="746">
Despite the slight downside bias and negative signals on Stochastic, we find the pair stable above Linear Regression Indicators indicating the extension of the upside move. Intraday trading above 101.70 keeps the possibility of bullishness valid, and since the pair is stable above it ,we will hold on to our positive expectations.
The trading range for today is among key support at 101.15 and key resistance at 103.75.
The general trend over short term basis is to the upside, as far as areas of 96.50 remain intact targeting 105.60.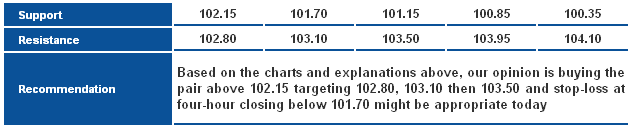 USD/JPY_S&R" title="USD/JPY_S&R" width="633" height="129">
USD/CHF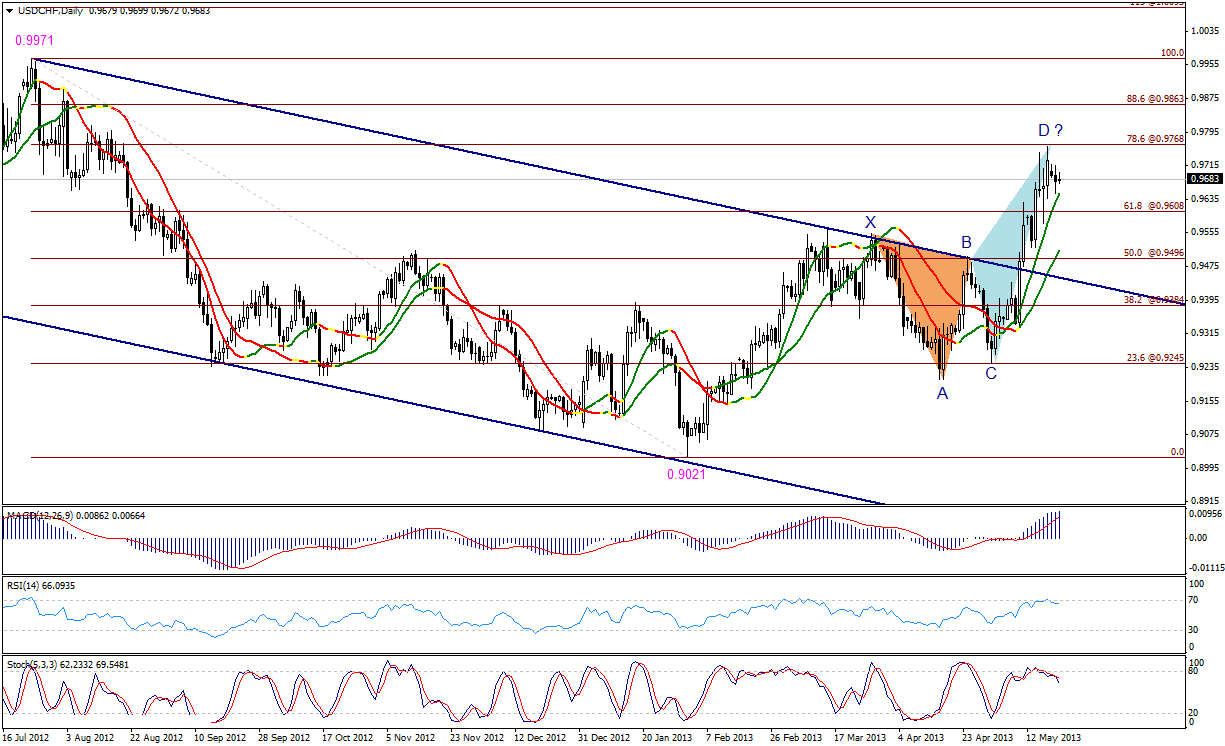 USD/CHF" title="USD/CHF" width="1225" height="746">
The bearish harmonic Butterfly Pattern’s effect managed to delay the upside move, but Linear Regression Indicators tend to be positive. The bearish harmonic pattern was formed after the breakout of the medium-descending channel, triggering a technical contradiction between harmonic and classic analysis today, especially that classically the pair is stable above 61.8% correction at 0.9610 shown on graph. We prefer to remain neutral as we need confirmation signals to favor one of the signals mentioned.
The trading range for today is among key support at 0.9515, and key resistance at 0.9865.
The general trend over short term basis is to the downside, stable at levels 0.9775 targeting 0.8860.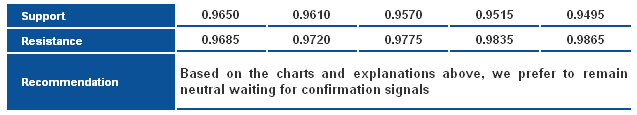 USD/CHF_S&R" title="USD/CHF_S&R" width="637" height="115">
USD/CAD USD/CAD" title="USD/CAD" width="640" height="385">
The pair dropped yesterday and is stable below 78.6% correction at 1.0270. Linear Regression Indicators are still positive, keeping the overall upside move valid, whereas the pair is trading within the ascending channel shown on graph. Volatility is expected and perhaps some bearish correction due to oversold signals on Stochastic, but trading above 1.0175 levels keeps the bullish intraday move valid.
The trading range for today is between the key support at 1.0140, and the key resistance at 1.0355.
The general trend over short term basis is to the upside, with steady daily closing above levels 0.9800 targeting 1.0485.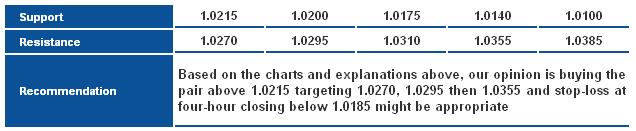 USD/CAD_S&R" title="USD/CAD_S&R" width="636" height="131">
AUD/USD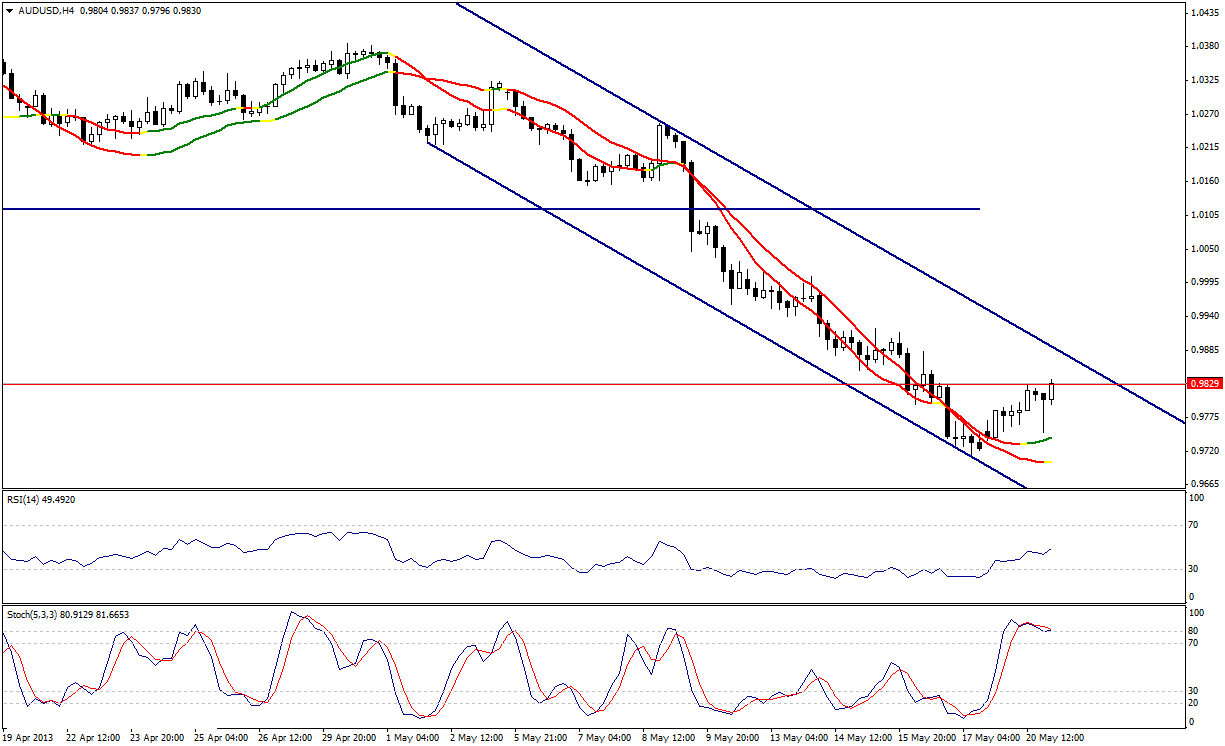 AUD/USD" title="AUD/USD" width="1225" height="746">
The AUD/USD rose during the Asian Session to above 0.9825-0.9830, where stability is conceived positive. Still, the overall bearish trend is prevalent so we can't favor the upside movement at the time being, especially as Stochastic is heading rapidly toward overbought areas. For now, we recommend neutrality waiting for clearer signals for a certain direction.
Trading range expected today is between the key support at 0.9690, and the key resistance 0.9900.
Short-term trend is donwside, targeting 0.9400 if 1.0710 remains intact.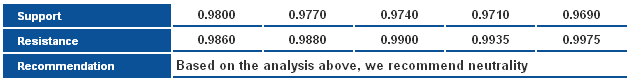 AUD/USD_S&R" title="AUD/USD_S&R" width="632" height="82">
NZD/USD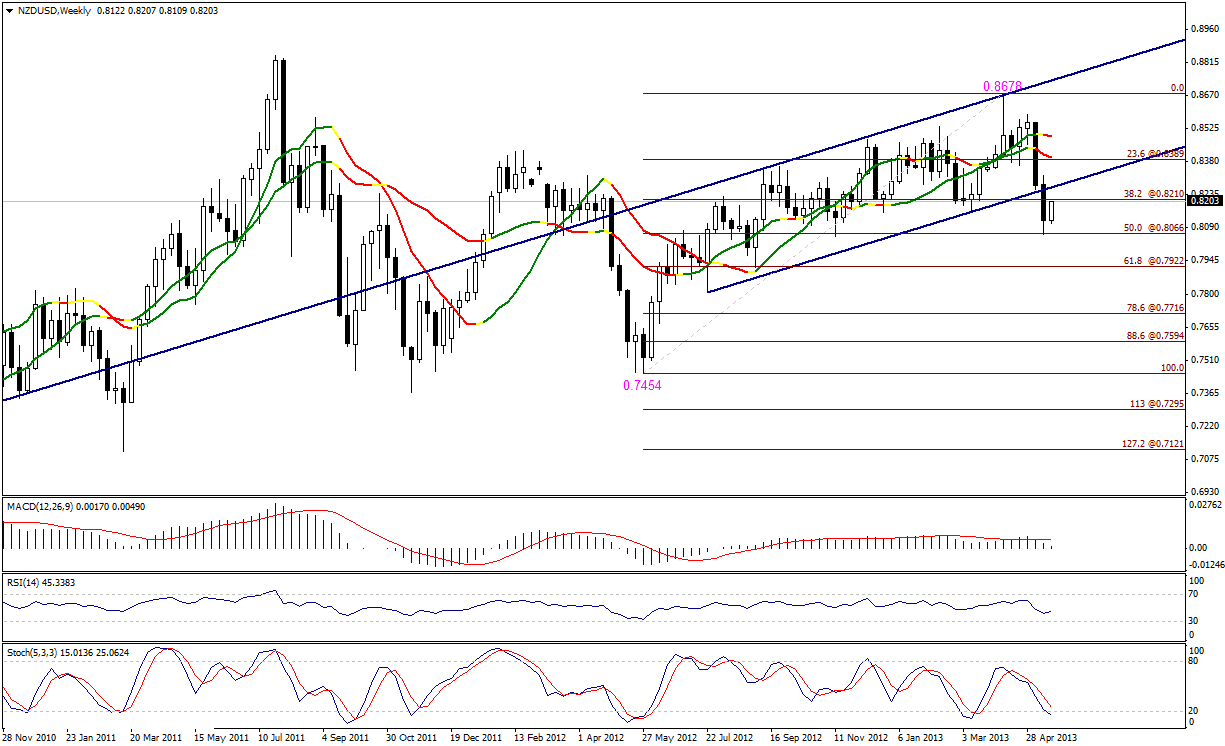 NZD/USD" title="NZD/USD" width="1225" height="746">
The NZD/USD's rise was contained below the bullish channel's key support, as indicated on the the weekly chart. The rise is also limited in levels below 0.8210 so a potential return of the downtrend is likely on Tuesday. Trading below 0.8280 points helps maintain expectations of a downtrend and Linear Regression Indicators are negative, supporting these expectations.
Trading range expected today is between the key support at 0.8080, and the key resistance 0.8310.
Short-term trend is bullish, targeting 0.7715 if 0.8400 remains intact.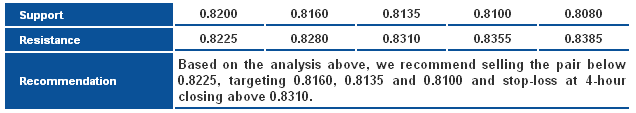 NZD/USD_S&R" title="NZD/USD_S&R" width="636" height="113">
GBP/JPY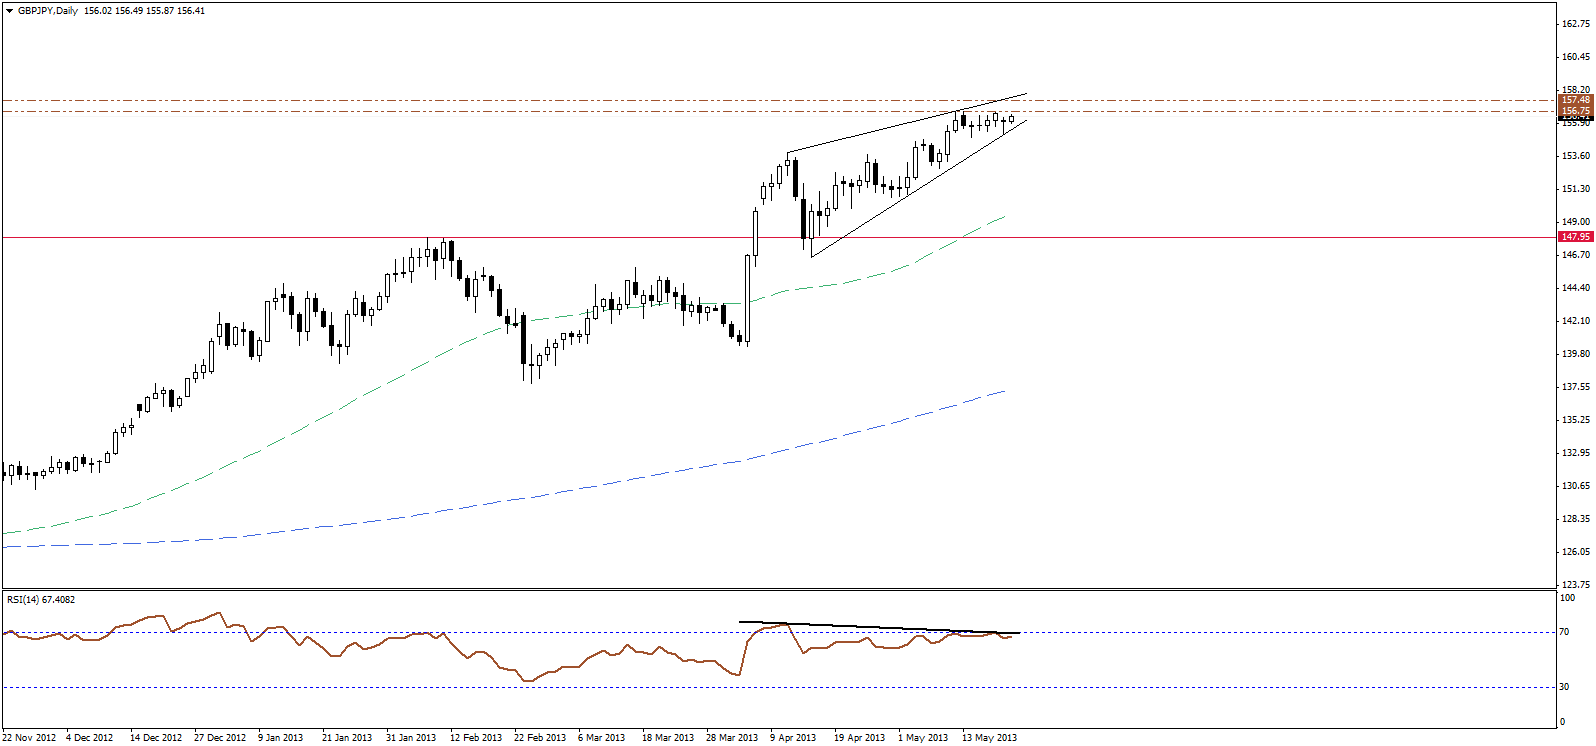 GBP/JPY" title="GBP/JPY" width="1596" height="746">
The GBPJPY resumed the bullish bias after testing the ascending support for the latest bullish wave, and currently heading towards the latest key high at 156.75 area. A break above this area could push for another leg higher, however there is a clear bearish divergence on RSI momentum indicator over the daily interval, and thus we prefer to move to the sidelines for now.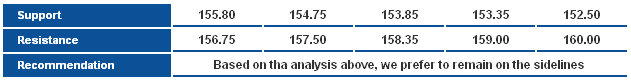 GBP/JPY_S&R" title="GBP/JPY_S&R" width="631" height="82">
EUR/JPY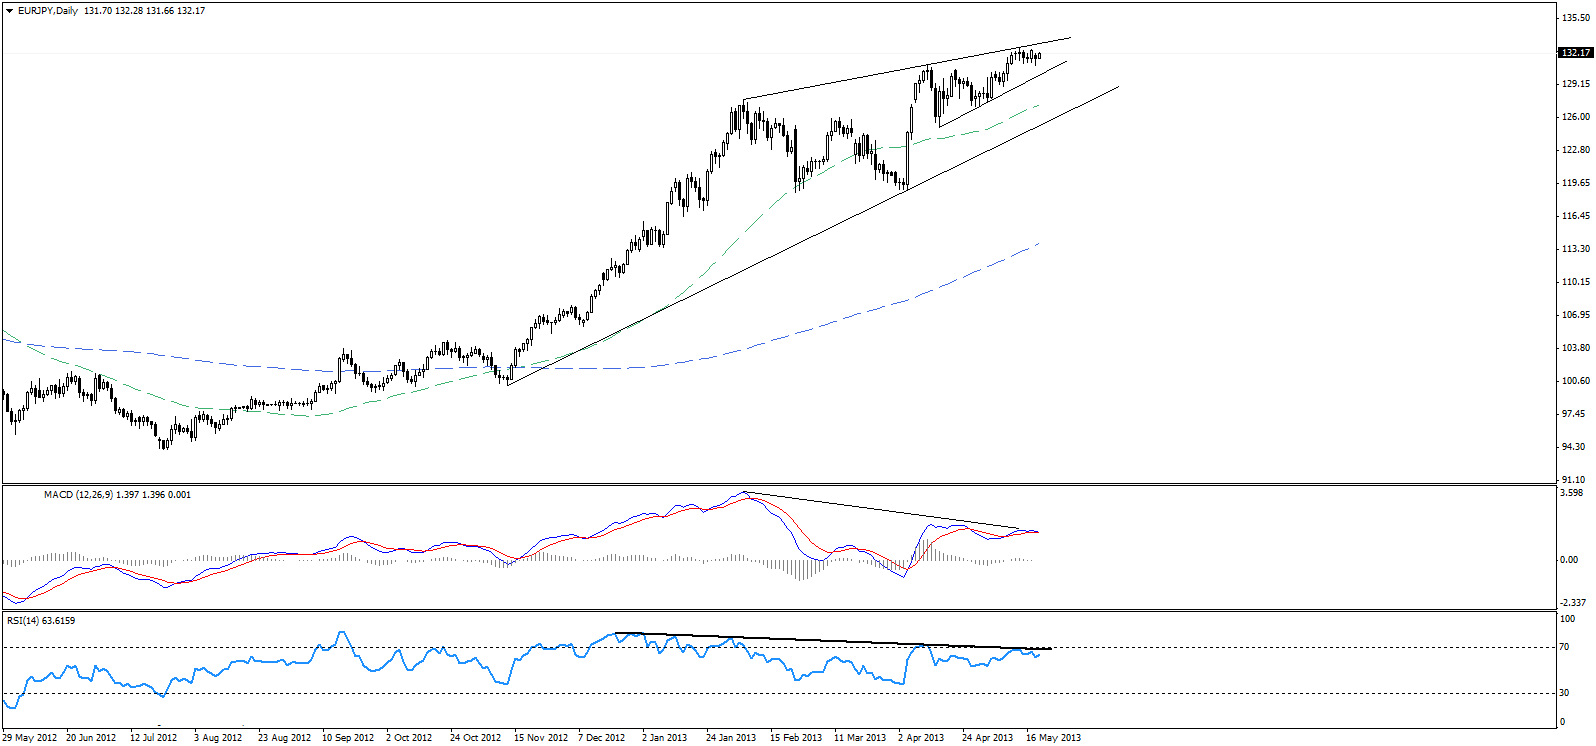 EUR/JPY" title="EUR/JPY" width="1596" height="746">
The multiple bearish divergence seen on the daily and four-hour charts is alarming, hinting we may see a downside reversal despite the ongoing push higher. However, a reversal needs to confirmed by a clear break and stability below 131.50 and preferably 131.10. Accordingly, we prefer to remain neutral for now.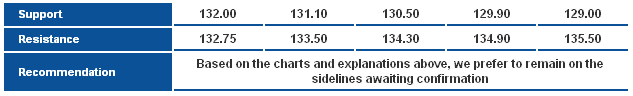 EUR/JPY_S&R" title="EUR/JPY_S&R" width="633" height="96">
EUR/GBP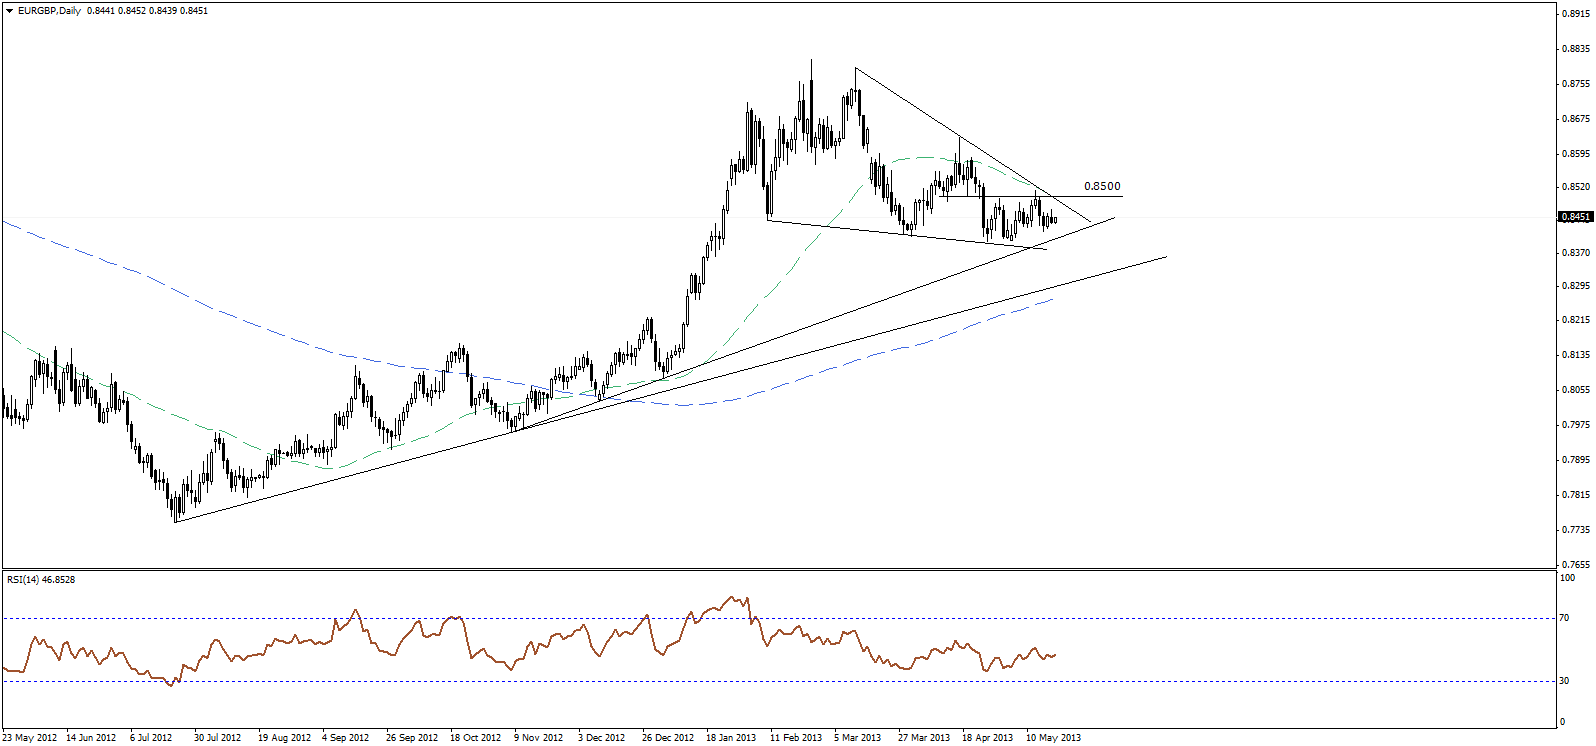 EUR/GBP" title="EUR/GBP" width="1596" height="746">
The EURGBP pair fails to maintain a directional bias, moving within a tight sideways range, below the key horizontal resistance at 0.8500 and above the key ascending support shown on image. Accordingly, we remain on the sidelines awaiting a breakout of this range. 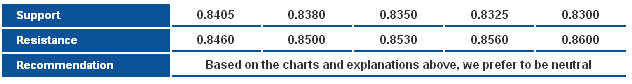 EUR/GBP_S&R" title="EUR/GBP_S&R" width="632" height="84">
- English (UK)
- English (India)
- English (Canada)
- English (Australia)
- English (South Africa)
- English (Philippines)
- English (Nigeria)
- Deutsch
- Español (España)
- Español (México)
- Français
- Italiano
- Nederlands
- Polski
- Português (Portugal)
- Português (Brasil)
- Русский
- Türkçe
- العربية
- Ελληνικά
- Svenska
- Suomi
- עברית
- 日本語
- 한국어
- 简体中文
- 繁體中文
- Bahasa Indonesia
- Bahasa Melayu
- ไทย
- Tiếng Việt
- हिंदी
Japan's Minister Of Economy Comments On JPY Weakening Spark USD Selloff
Published 05/21/2013, 05:43 AM
Updated 07/09/2023, 06:31 AM
Japan's Minister Of Economy Comments On JPY Weakening Spark USD Selloff
Latest comments
Loading next article…
Install Our App
Risk Disclosure: Trading in financial instruments and/or cryptocurrencies involves high risks including the risk of losing some, or all, of your investment amount, and may not be suitable for all investors. Prices of cryptocurrencies are extremely volatile and may be affected by external factors such as financial, regulatory or political events. Trading on margin increases the financial risks.
Before deciding to trade in financial instrument or cryptocurrencies you should be fully informed of the risks and costs associated with trading the financial markets, carefully consider your investment objectives, level of experience, and risk appetite, and seek professional advice where needed.
Fusion Media would like to remind you that the data contained in this website is not necessarily real-time nor accurate. The data and prices on the website are not necessarily provided by any market or exchange, but may be provided by market makers, and so prices may not be accurate and may differ from the actual price at any given market, meaning prices are indicative and not appropriate for trading purposes. Fusion Media and any provider of the data contained in this website will not accept liability for any loss or damage as a result of your trading, or your reliance on the information contained within this website.
It is prohibited to use, store, reproduce, display, modify, transmit or distribute the data contained in this website without the explicit prior written permission of Fusion Media and/or the data provider. All intellectual property rights are reserved by the providers and/or the exchange providing the data contained in this website.
Fusion Media may be compensated by the advertisers that appear on the website, based on your interaction with the advertisements or advertisers.
© 2007-2024 - Fusion Media Limited. All Rights Reserved.