January Barometer Flashes A ‘Buy’. Now What?

Published 02/05/2017, 12:54 AM
Updated 07/09/2023, 06:31 AM
DJI
-

Three cheers – for the first time since 2013, the January Barometer is bullish. The January Barometer was devised by Yale Hirsch in the early 1970’s and is still tracked today at STA by his son Jeffrey Hirsch. The simple theory is that “as January goes, so goes the rest of the year”, if January shows a gain then the 11 months from end of January through the end of December should also show a gain.

(See also A Two-Fund Portfolio for the Next Three Months)

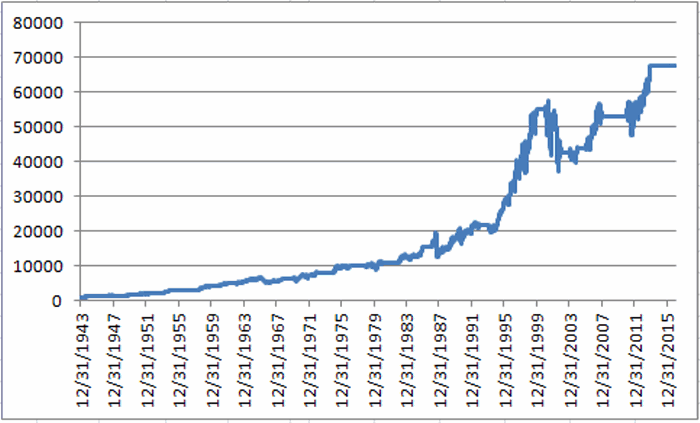
Using the Dow Jones Industrials Average, Figure 1 displays the growth of $1,000 invested in the Dow from the end of January through the end of December only during those years when the Dow Industrials showed a gain during the month of January.
Dow Jones Yearly Chart

Figure 1 – Growth of $1,000 invested in the Dow Jones Industrials Average ONLY between end of January and end of December if January shows a gain.

For the record, since 1943 following a gain for the Dow Industrials during January, February through December shows:

  • # times up = 40 (85% of the time)
  • # times down = 7 (15% of the time)
  • Average Gain = +13.2%
  • Average Loss = (-8.4%)

The year-by-year results appear in Figure 2:

Yearly Results Chart

Figure 2 – Year-by-Year Dow % +(-) following an UP January (price data only, NOT total return).

How to Use AND How NOT To Use This Information

The proper way to use this information is as “weight of the evidence” – i.e., as a reminder to be patient in giving the bullish case the benefit of the doubt between now and December 31st, 2017.

The improper way to use this information is to assume that things are “All Clear” between now and the end of the year and that you can simply forget all about your stock market investments, because there can be countervailing influences.

Latest comments

Loading next article…
Risk Disclosure: Trading in financial instruments and/or cryptocurrencies involves high risks including the risk of losing some, or all, of your investment amount, and may not be suitable for all investors. Prices of cryptocurrencies are extremely volatile and may be affected by external factors such as financial, regulatory or political events. Trading on margin increases the financial risks.
Before deciding to trade in financial instrument or cryptocurrencies you should be fully informed of the risks and costs associated with trading the financial markets, carefully consider your investment objectives, level of experience, and risk appetite, and seek professional advice where needed.
Fusion Media would like to remind you that the data contained in this website is not necessarily real-time nor accurate. The data and prices on the website are not necessarily provided by any market or exchange, but may be provided by market makers, and so prices may not be accurate and may differ from the actual price at any given market, meaning prices are indicative and not appropriate for trading purposes. Fusion Media and any provider of the data contained in this website will not accept liability for any loss or damage as a result of your trading, or your reliance on the information contained within this website.
It is prohibited to use, store, reproduce, display, modify, transmit or distribute the data contained in this website without the explicit prior written permission of Fusion Media and/or the data provider. All intellectual property rights are reserved by the providers and/or the exchange providing the data contained in this website.
Fusion Media may be compensated by the advertisers that appear on the website, based on your interaction with the advertisements or advertisers.
© 2007-2025 - Fusion Media Limited. All Rights Reserved.