👀 Ones to watch: The MOST undervalued stocks to buy right nowSee Undervalued Stocks

Dow Jones, S&P 500 Futures Decline

Published 01/14/2016, 05:13 AM
Updated 07/09/2023, 06:31 AM
ESZ24
-
1YMZ24
-

Sharp fall has been witnessed from 50% Fibonacci retracement, taking Dow Jones below 61.8% along with a confirmed closing below it as seen on the provided daily chart.
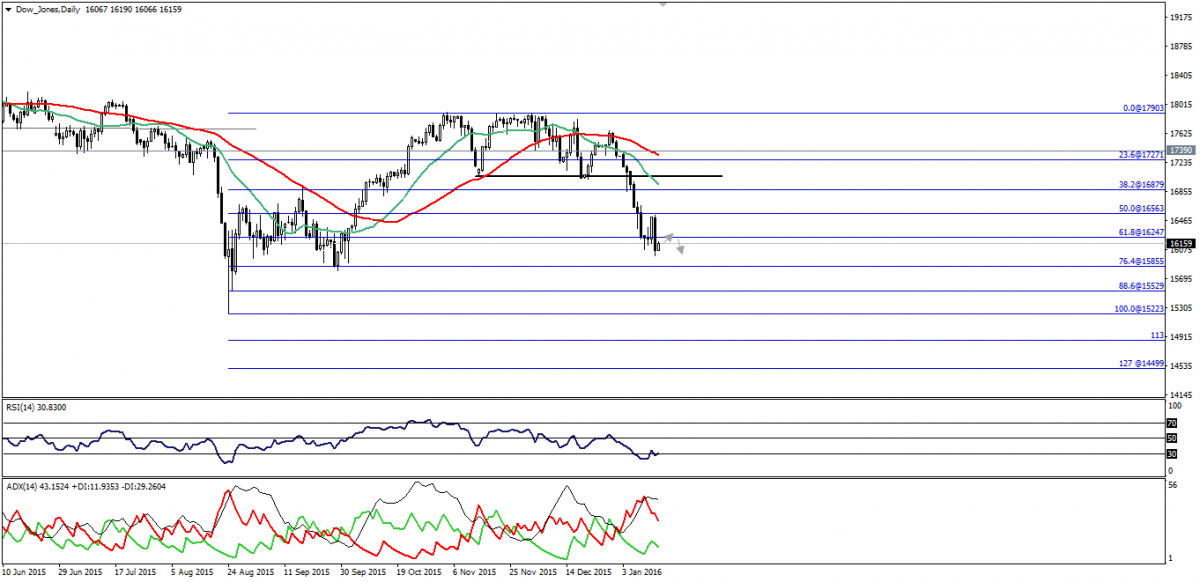
Dow Jones Daily Chart

RSI14 is still in need for a relief, while the strength of the bearishness decreased according to ADX reading.

However, we will depend on the afore-mentioned negative closing to suggest potential bearish actions today.

A break below 16000.00 psychological will accelerate.

Support: 16100.00-16000.00-15855.00

Resistance: 16250.00-16320.00-16460.00

Direction: Bearish

S&P 500 has declined to trade below 76.4% Fibonacci following yesterday’s negative closing below this level.
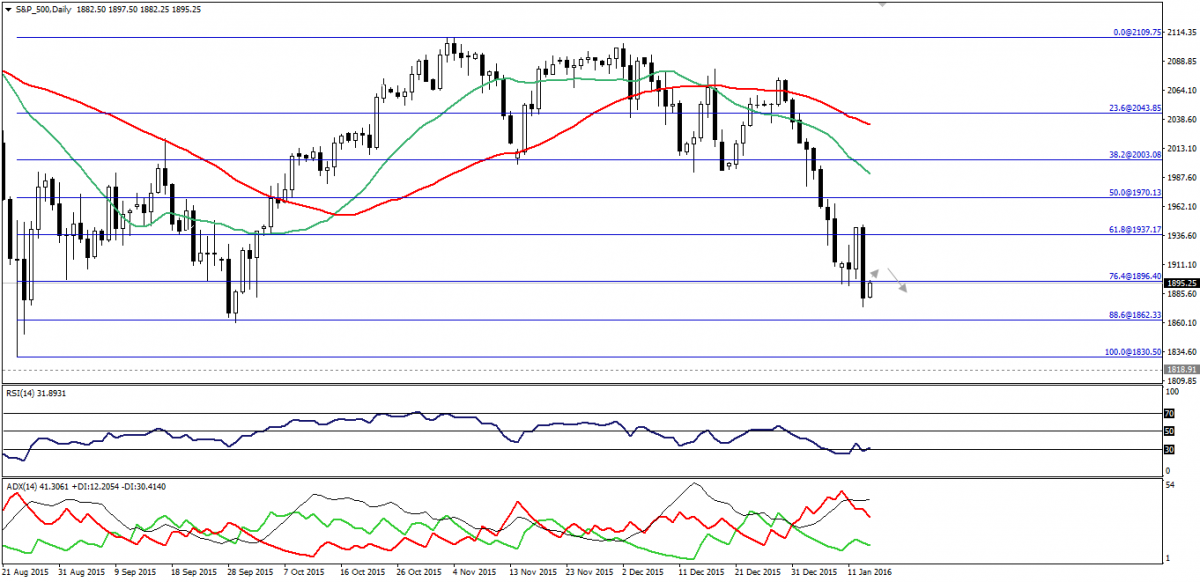
S&P 500 Daily Chart

We will depend on yesterday’s long black candle and negativity of closing below 76.4% to propose potential downside resumption although RSI14 needs some kind of relief.

A break below 1872.00 will be a very negative catalyst over short-term basis.

Support: 1880.00-1872.00-1850.00

Resistance: 1905.00-1915.00-1932.00

Direction: Bearish

Latest comments

Loading next article…
Risk Disclosure: Trading in financial instruments and/or cryptocurrencies involves high risks including the risk of losing some, or all, of your investment amount, and may not be suitable for all investors. Prices of cryptocurrencies are extremely volatile and may be affected by external factors such as financial, regulatory or political events. Trading on margin increases the financial risks.
Before deciding to trade in financial instrument or cryptocurrencies you should be fully informed of the risks and costs associated with trading the financial markets, carefully consider your investment objectives, level of experience, and risk appetite, and seek professional advice where needed.
Fusion Media would like to remind you that the data contained in this website is not necessarily real-time nor accurate. The data and prices on the website are not necessarily provided by any market or exchange, but may be provided by market makers, and so prices may not be accurate and may differ from the actual price at any given market, meaning prices are indicative and not appropriate for trading purposes. Fusion Media and any provider of the data contained in this website will not accept liability for any loss or damage as a result of your trading, or your reliance on the information contained within this website.
It is prohibited to use, store, reproduce, display, modify, transmit or distribute the data contained in this website without the explicit prior written permission of Fusion Media and/or the data provider. All intellectual property rights are reserved by the providers and/or the exchange providing the data contained in this website.
Fusion Media may be compensated by the advertisers that appear on the website, based on your interaction with the advertisements or advertisers.
© 2007-2024 - Fusion Media Limited. All Rights Reserved.