Jabal Omar Development Co. (JOMAR:AB) Shows Strength Relative To The Wider Saudi Market
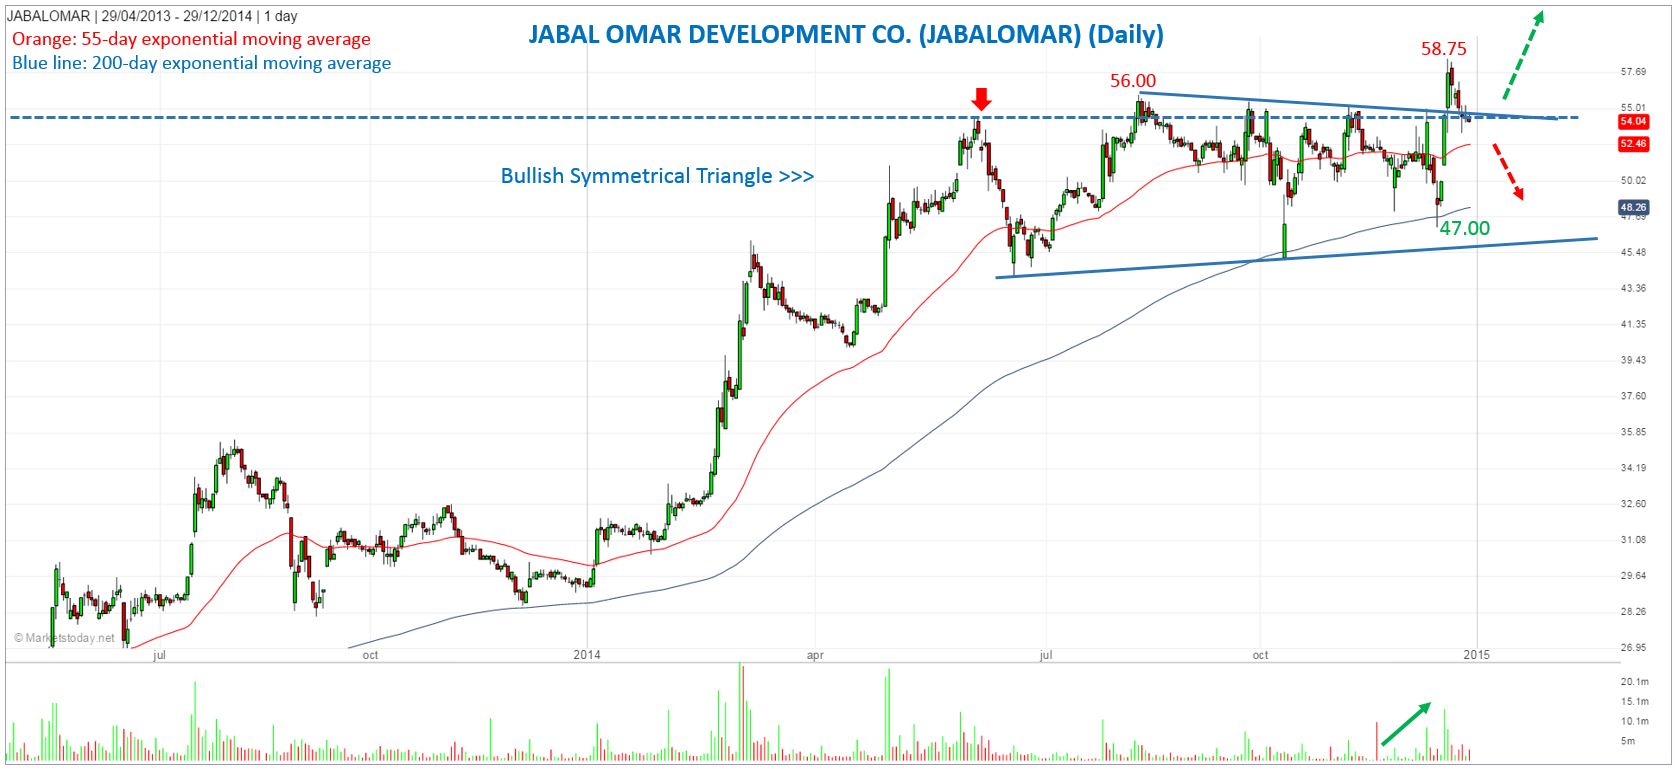
Jabal Omar Development Co. may be completing a brief pullback following a bullish breakout of a multi-month Symmetrical Triangle formation. Once signs of strength return the stock should be ready to continue its new leg higher.

The breakout occurred two weeks ago as Jabal Omar made a decisive move above 55.00 with high volume. It quickly found resistance at 58.75, the high of the day, and has been retracing back into the top angled support zone of the pattern since then. Yesterday, Jabal Omar closed at 54.04, down 0.64% on the day.
Based on the depth of the triangle the potential minimum target is 66.40.
Given the 35.3% correction that completed a couple of weeks ago in the Tadawul All Share Index (TASI), Jabal Omar’s ability to breakout higher (above 2014 high of 56.00) and stay relatively close to the most recent highs shows its relative strength.

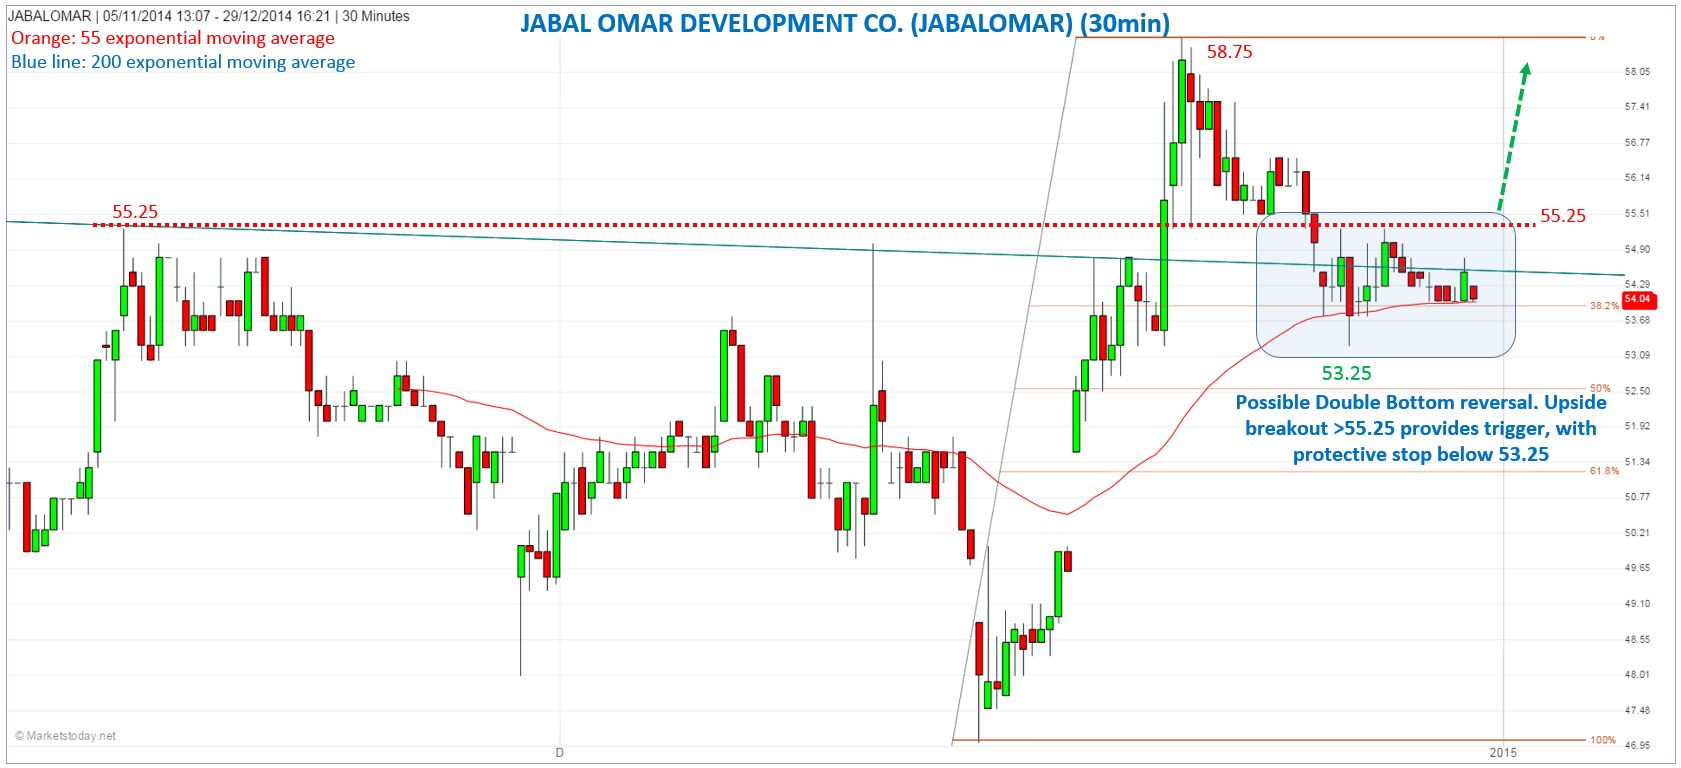
The intra-day 30 minute chart can be used to design an entry strategy as a possible bullish Double Bottom trend reversal pattern has formed. An upside breakout is indicated on trade above 55.25 and is a sign that Jabal Omar is getting stronger and could be ready to follow through on the initial bullish breakout of the triangle pattern.
Near term support is at the recent 53.25 low. A drop below that price level signals a deeper correction and invalidates the potential double bottom. In that case watch for a new bullish intraday reversal signal at a lower price. (www.marketstoday.net)
