J. C. Penney Company, Inc. (JCP) is a holding company. The Company is a retailer, operating 1,106 department stores in 49 states and Puerto Rico as of January 29, 2011.
The stock is popping based on a bunch of news. Here are some headlines, which actually suffice:
J.C. Penney jumps after saying 2012 EPS may beat at 2010 earnings
J.C. Penney unveils new prices, logo, store design
jcpenney Unveils Long Term Financial Outlook at Day Two of Launch Event in New York City
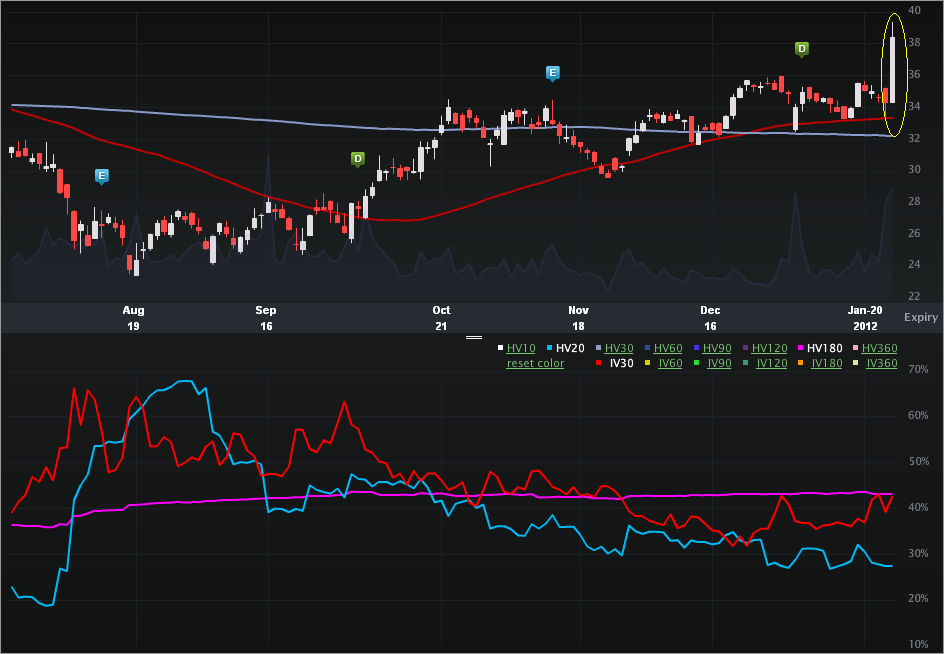
This overhaul ‘n stuff has popped the stock near an annual high and has pushed the vol as well. Let’s turn to the Charts Tab (6 months), below. The top portion is the stock price, the bottom is the vol (IV30™ - red vs HV20 - blue vs HV180 - pink).
On the vol side, we can see that while the implied has popped today, it’s still considerably below its recent highs in the last 6 months. In fact, the 52 wk range in IV30™ is [31.87%, 66.21%] – that puts the current level at the 29th percentile (annual). We can also see the stock pop today on the chart – this is a six month high. The 52 wk range in stock price is [$23.14, $40.23].
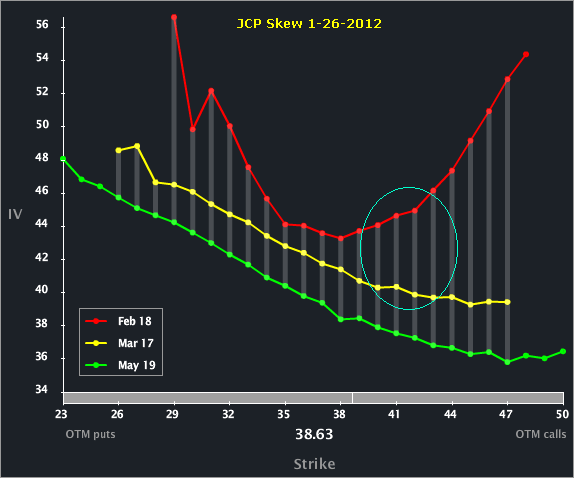
All of this is semi-interesting, but the attention grabbing phenomenon lies in the skew chart.
The skew in Feb has turned parabolic, with the upside skew bid to the news and the order flow. The next earnings release for JCP is 2-24-2012, which is after Feb expiry. That means the Mar options have an embedded vol event that Feb does not. Tricky…
The most obvious vol diff between the front two months is the upside. I’ve circled the divergence that has formed given that Feb has the parabolic shape, while Mar is “normal”, in that the upside skew is lower than the ATM..
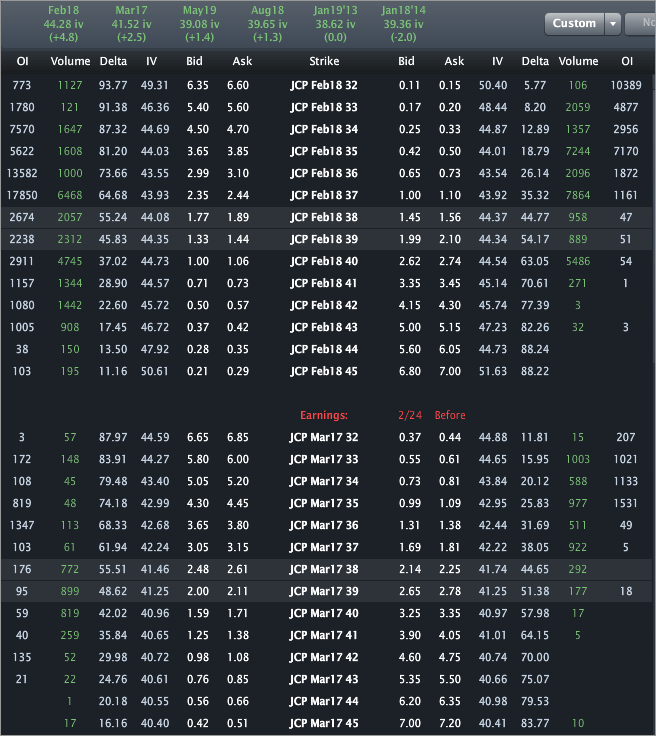
Let’s turn to the Options Tab for completeness.
I wrote about this one for TheStreet (OptionsProfits), so no specific trade analysis here. I can say that the ATM vols are ~44.2% and ~41.5% for Feb and Mar, respectively. But, looking at the upside skew, the vol difference increases rather substantially.
This is trade analysis, not a recommendation.
- English (UK)
- English (India)
- English (Canada)
- English (Australia)
- English (South Africa)
- English (Philippines)
- English (Nigeria)
- Deutsch
- Español (España)
- Español (México)
- Français
- Italiano
- Nederlands
- Português (Portugal)
- Polski
- Português (Brasil)
- Русский
- Türkçe
- العربية
- Ελληνικά
- Svenska
- Suomi
- עברית
- 日本語
- 한국어
- 简体中文
- 繁體中文
- Bahasa Indonesia
- Bahasa Melayu
- ไทย
- Tiếng Việt
- हिंदी
J.C. Penney Company: Overhaul and EPS Guidance Push Stock and Volume
Published 01/27/2012, 02:44 AM
Updated 07/09/2023, 06:31 AM
J.C. Penney Company: Overhaul and EPS Guidance Push Stock and Volume
Latest comments
Loading next article…
Install Our App
Risk Disclosure: Trading in financial instruments and/or cryptocurrencies involves high risks including the risk of losing some, or all, of your investment amount, and may not be suitable for all investors. Prices of cryptocurrencies are extremely volatile and may be affected by external factors such as financial, regulatory or political events. Trading on margin increases the financial risks.
Before deciding to trade in financial instrument or cryptocurrencies you should be fully informed of the risks and costs associated with trading the financial markets, carefully consider your investment objectives, level of experience, and risk appetite, and seek professional advice where needed.
Fusion Media would like to remind you that the data contained in this website is not necessarily real-time nor accurate. The data and prices on the website are not necessarily provided by any market or exchange, but may be provided by market makers, and so prices may not be accurate and may differ from the actual price at any given market, meaning prices are indicative and not appropriate for trading purposes. Fusion Media and any provider of the data contained in this website will not accept liability for any loss or damage as a result of your trading, or your reliance on the information contained within this website.
It is prohibited to use, store, reproduce, display, modify, transmit or distribute the data contained in this website without the explicit prior written permission of Fusion Media and/or the data provider. All intellectual property rights are reserved by the providers and/or the exchange providing the data contained in this website.
Fusion Media may be compensated by the advertisers that appear on the website, based on your interaction with the advertisements or advertisers.
© 2007-2024 - Fusion Media Limited. All Rights Reserved.
