Big Triangle Scenarios
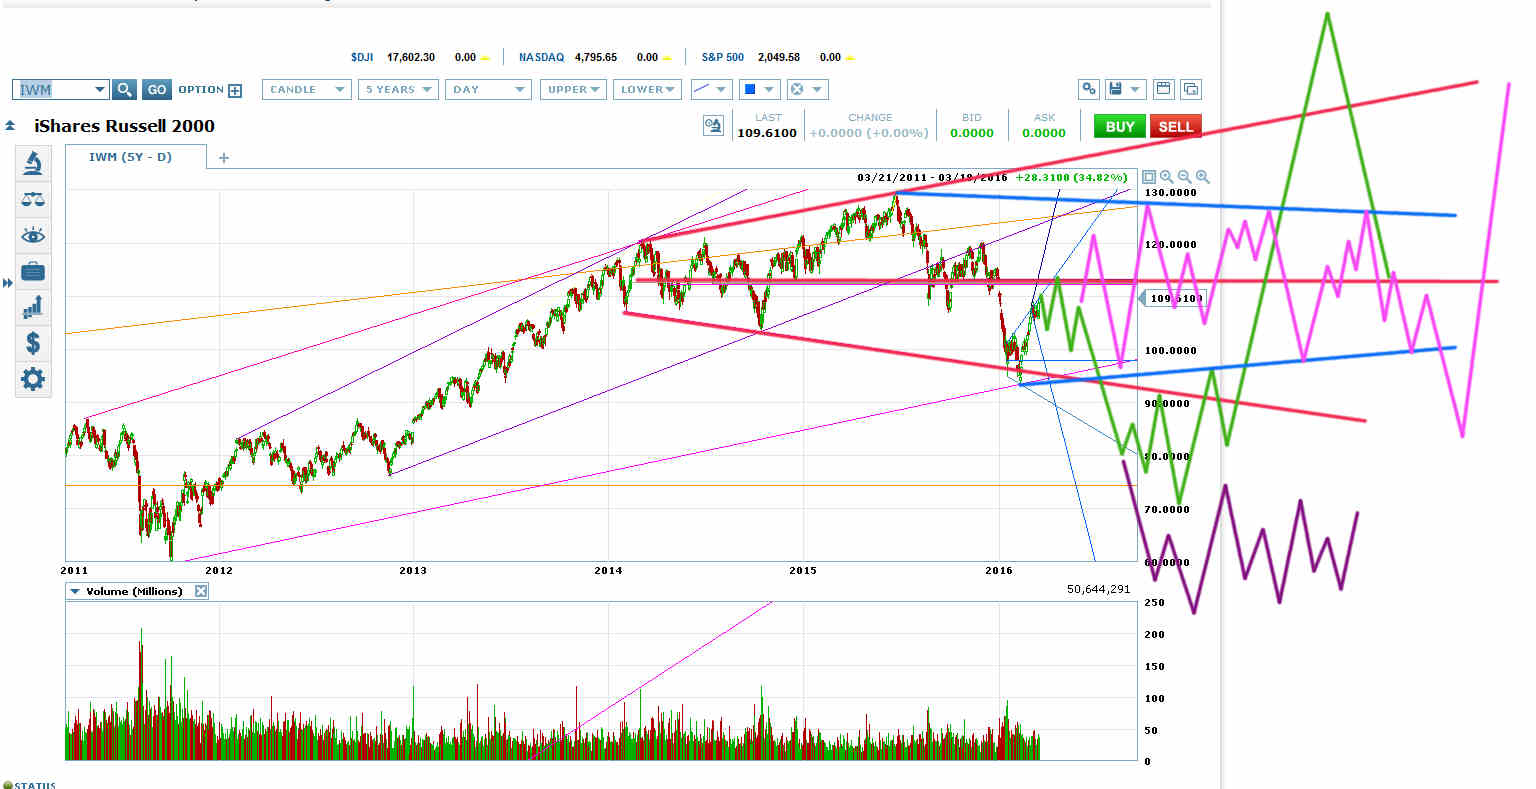
IWM is 2.5 Points from Its Big Red Megaphone VWAP
NYSE:IWM is 2.5 points from VWAP of its big red topping megaphone at 112.50. It could continue to extend this move all the way to that magic line, or it could plunge next week within a megaphone it’s forming before a final melt-up to that line.
And that line will be the critical decision point for pretty much everything.
In the years before worldwide coordinated central planning, IWM would have formed a small topping pattern at or across the red megaphone VWAP before a breakout downwards from the formation with a target of roughly 55 (purple scenario).
But it’s pretty clear that the central banks are trying to keep the markets within the recent trading range. At 1800, the ECB and JCB expand QE or negative interest rates. On Friday, now that the market is approaching the top of the range, the Fed’s Bullard started talking again about how it was time to start pushing up rates.
So the most likely thing to happen here is for the market to form a big triangle between the summer of 2015 highs and the February 2016 lows (pink scenario in chart above), then break out of the triangle to the big megaphone top or bottom.
It’s a classic way for a megaphone to set up a big move without actually breaking the price out of the megaphone.
Here are the triangle scenarios on ES:
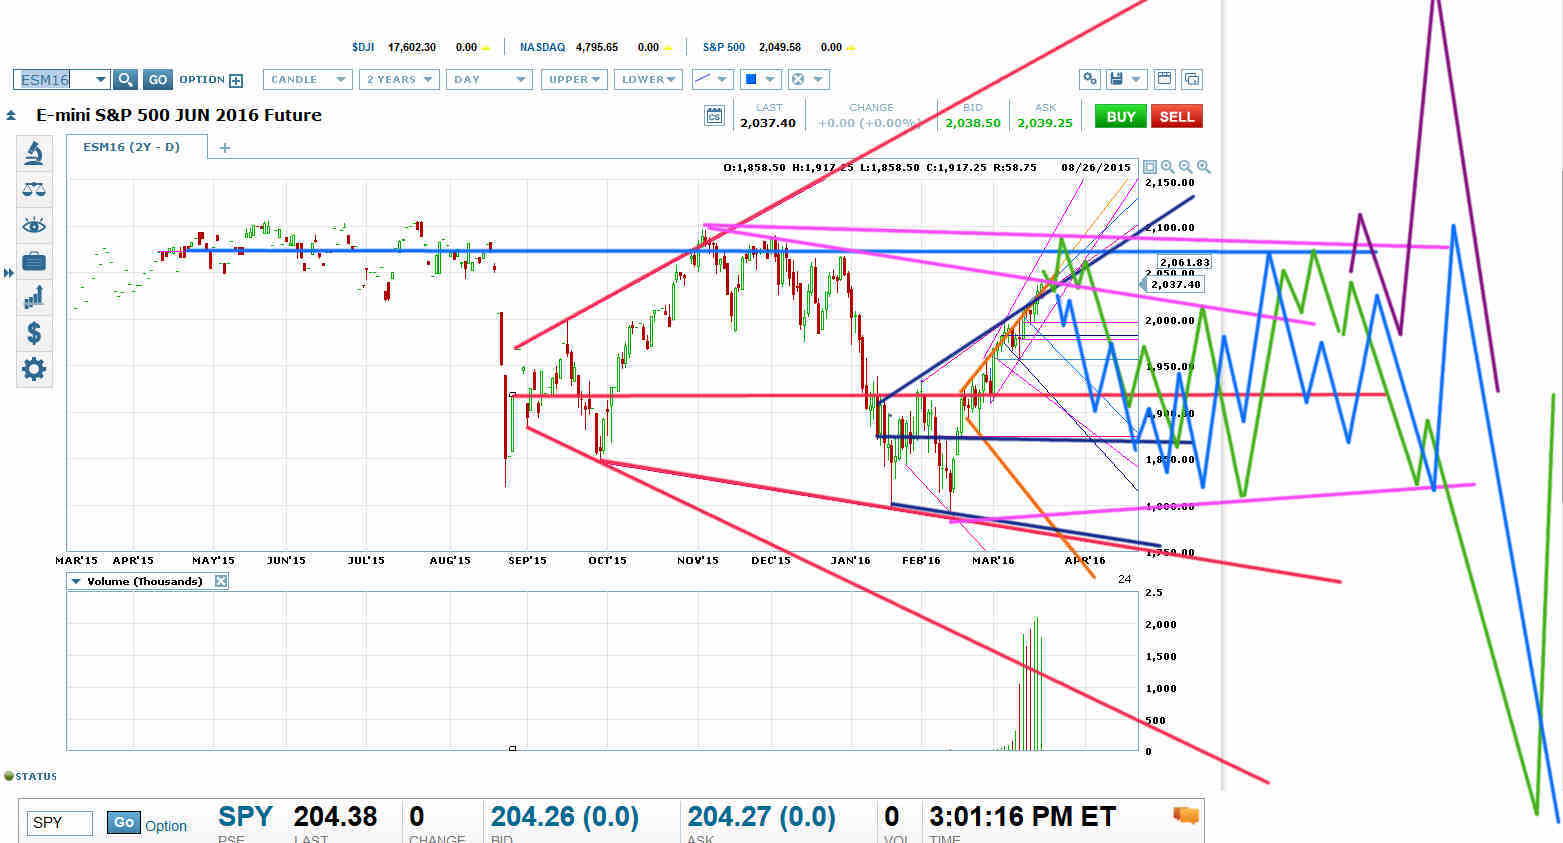
ES Triangle Scenarios
Note that ES could just head straight up to the likely triangle top (green scenario) or it could be at the tricky middle part of the triangle where it seems to complete a smaller triangle before breaking out a small amount to the top of the real triangle (blue scenario).
Here are the scenarios on NASDAQ:QQQ:
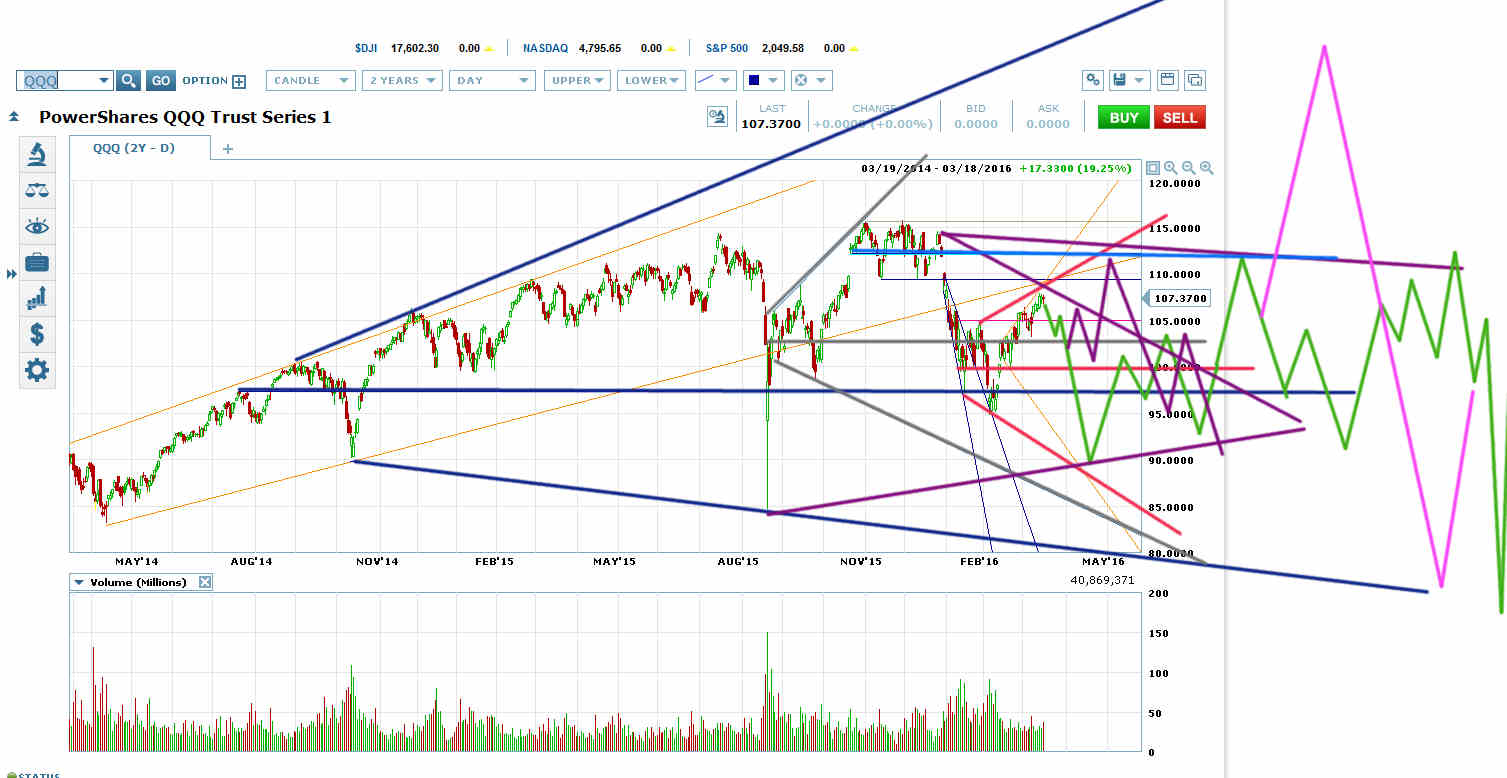
QQQ Triangle Scenarios
Short-Term NYMO Trading Set-Up
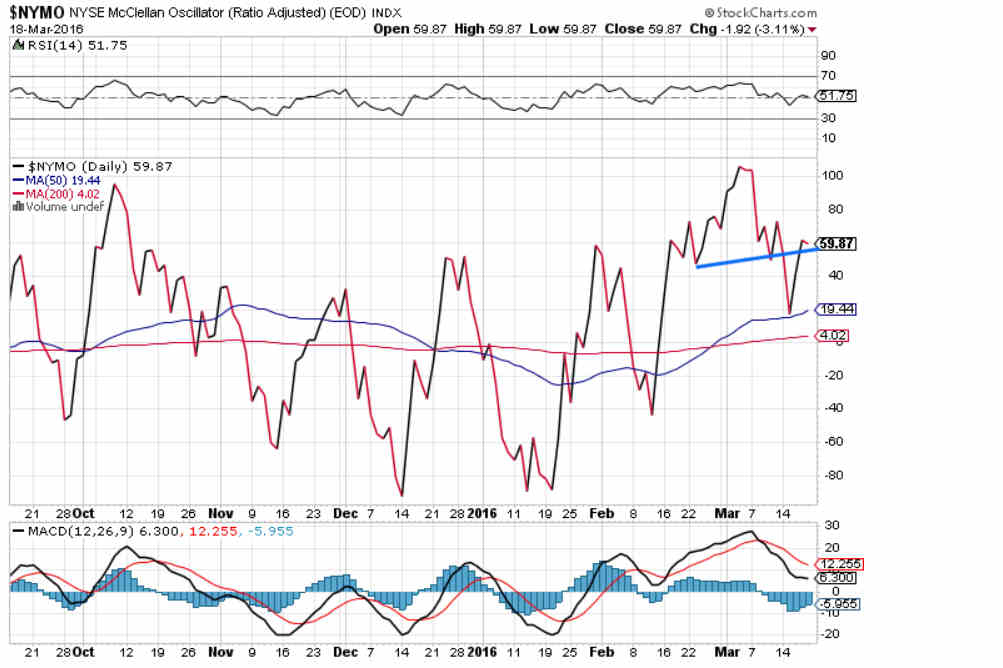
NYMO has Retraced to Its H&S Neckline and Put in a Small Divergence from Price on Friday
NYMO has retraced to its H&S neckline. The target for the H&S breakout remains below at -20.
On Friday, NYMO diverged from price by putting in a very small move down.
@DowdEdward posted on twitter yesterday that this is a Kennedy Gammage trading set-up. Roughly 75% of the time you’d expect the major market indices to launch into a big move of 1% or more within the next four trading sessions. Roughly 67% of the time the market would move in the direction of that little NYMO dip.
Crash in the CPCE
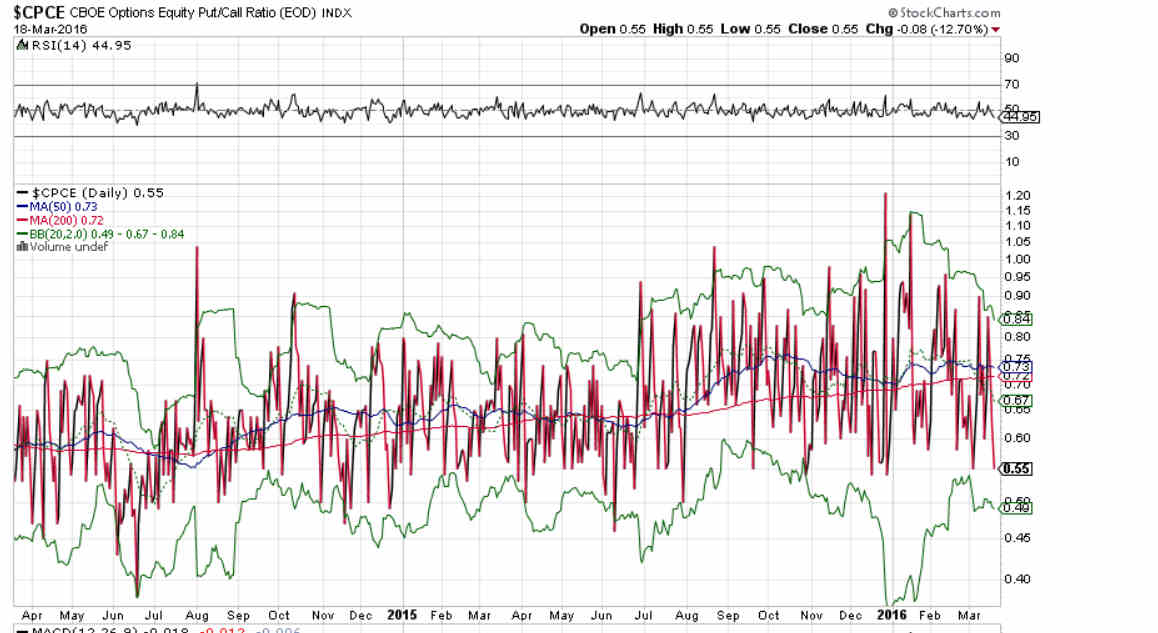
The CBOE equities put-call ratio crashed to 0.55 at the bottom of its recent range on Friday as well. Although the set-up would be stronger if the ratio got down to its bottom BB at 0.49, you’d often see the market drop when this put-call ratio gets this low.
The CBOE Equities Put-Call Ratio Fell Hard Friday
